Digital Data of Control System

09/15/2024

Digital Data Definition


Digital data in control systems consists of discrete or sampled data that represents continuous signals in a digital format.


Sampling Process


Sampling is the conversion of analog signals to digital signals using a sampler, which switches ON and OFF.


The sampling process converts analog signals into digital signals using a switch, called a sampler, that turns ON and OFF. For an ideal sampler, the output pulse width is very small (almost zero). In discrete systems, Z transformations play a crucial role, similar to Fourier transform in continuous systems. Let’s explore Z transformations and their uses in detail.


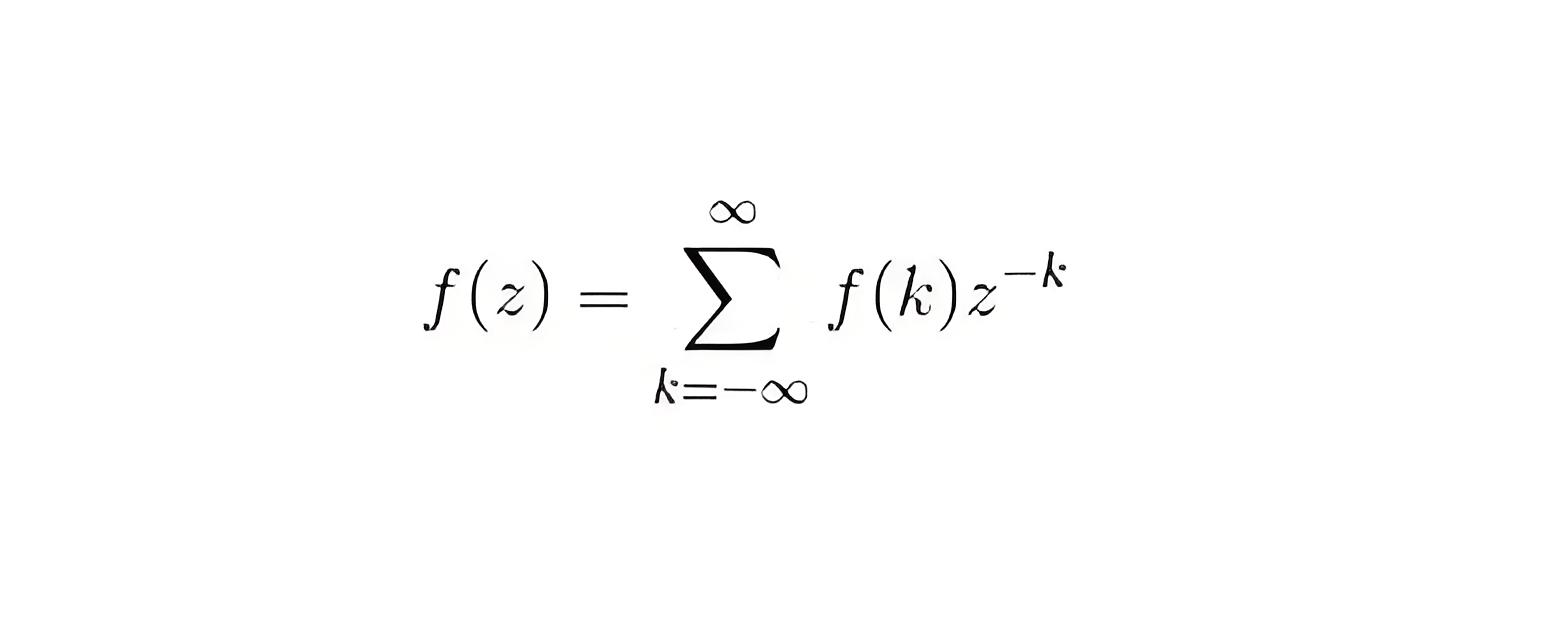
We define z transform as


Where, F(k) is a discrete data

Z is a complex number

F (z) is Fourier transform of f (k).


0a1e0386858964330c27353c80f75f3f.jpeg


Important Properties of z transformation are written below


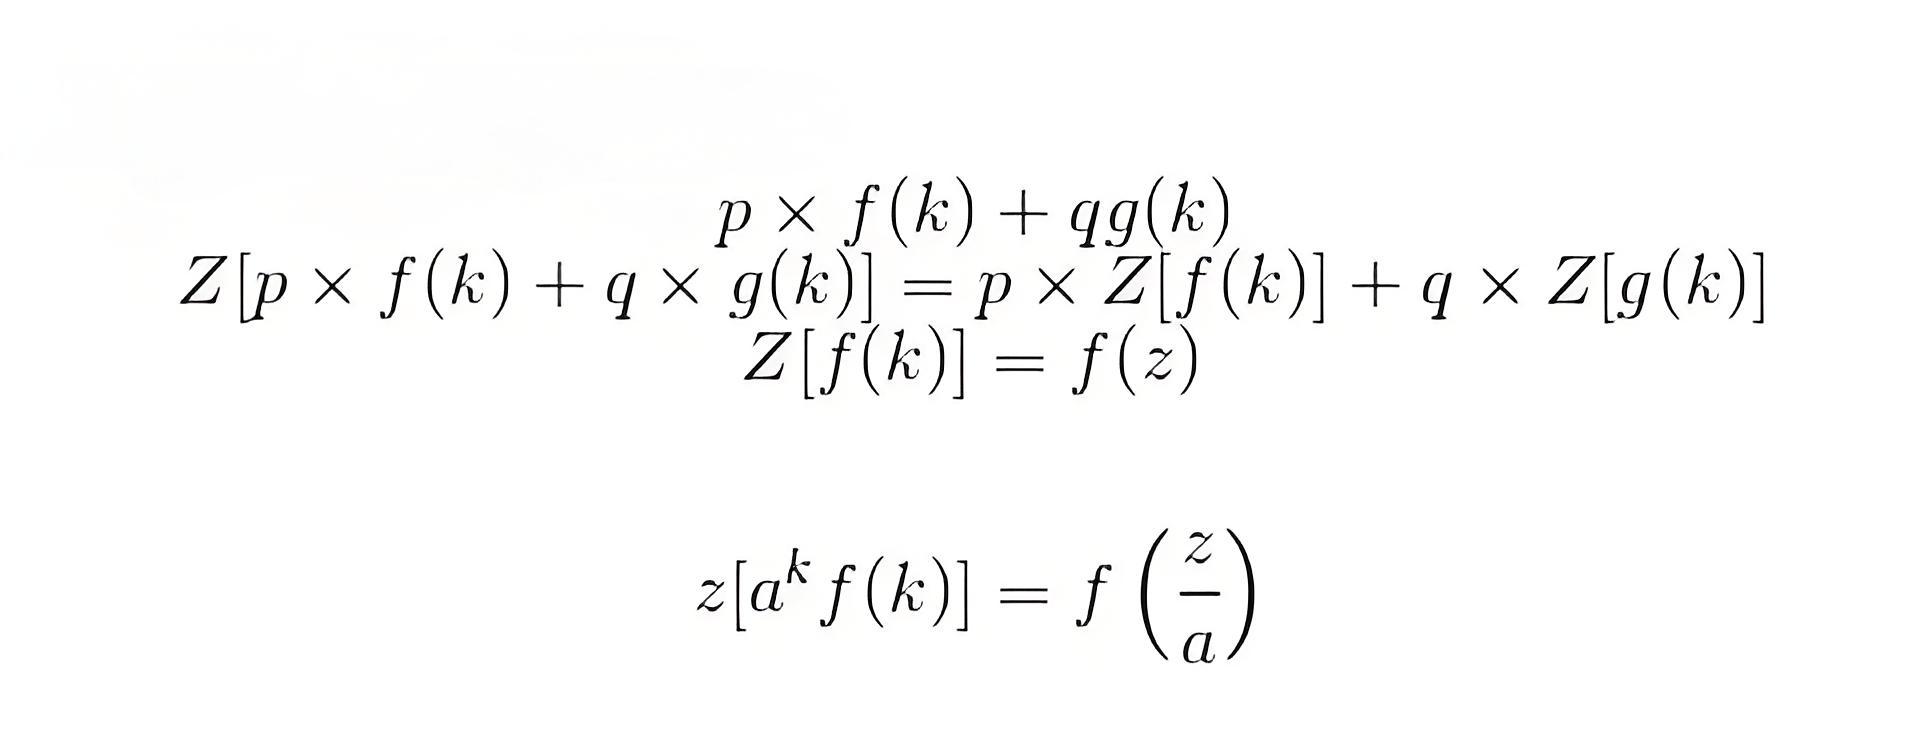
Linearity


Let us consider summation of two discrete functions f (k) and g (k) such that


such that p and q are constants, now on taking the Laplace transform we have by property of linearity:


Change of Scale: let us consider a function f(k), on taking the z transform we have


then we have by change of scale property


bed1b6bd060b422517c0f7e6c4daa32f.jpeg


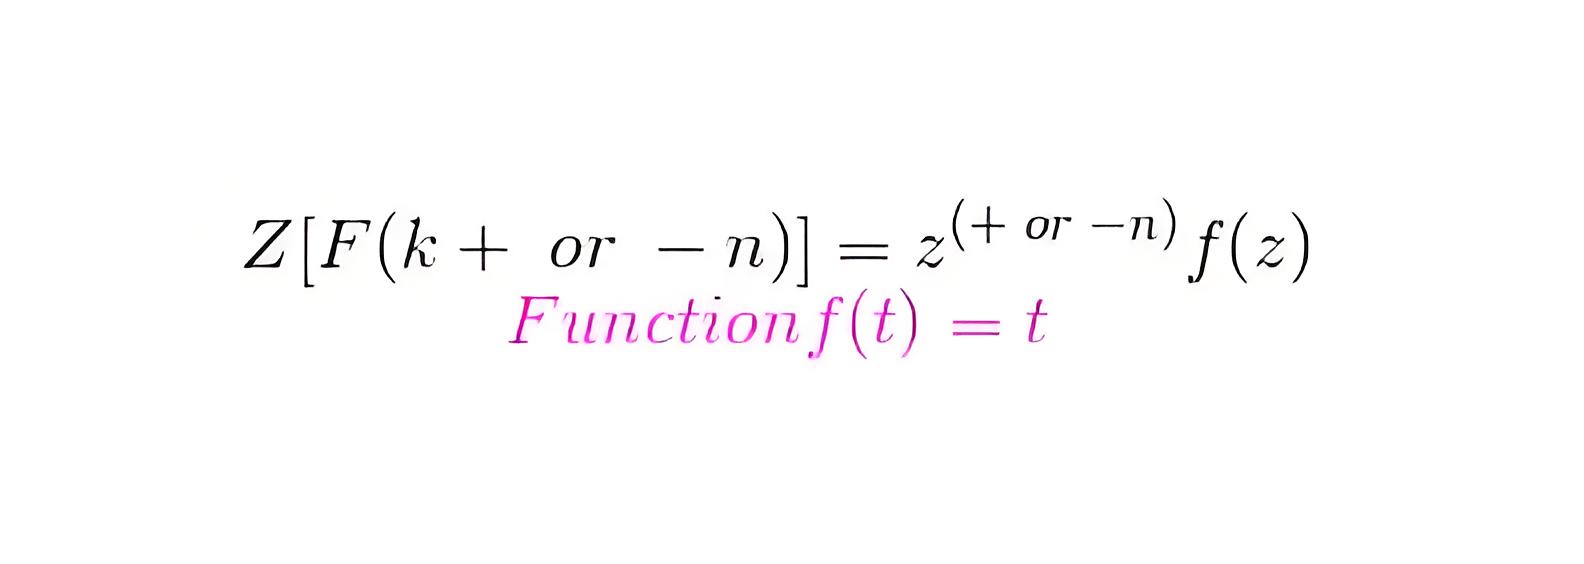
Shifting Property: As per this property


Now let us discuss some important z transforms and I will suggest readers to learn these transforms:


Laplace transformation of this function is 1/s 2 and the corresponding f(k) = kT. Now the z transformation of this function is


28d876cd31035b7a128c0366f5dc21f6.jpeg


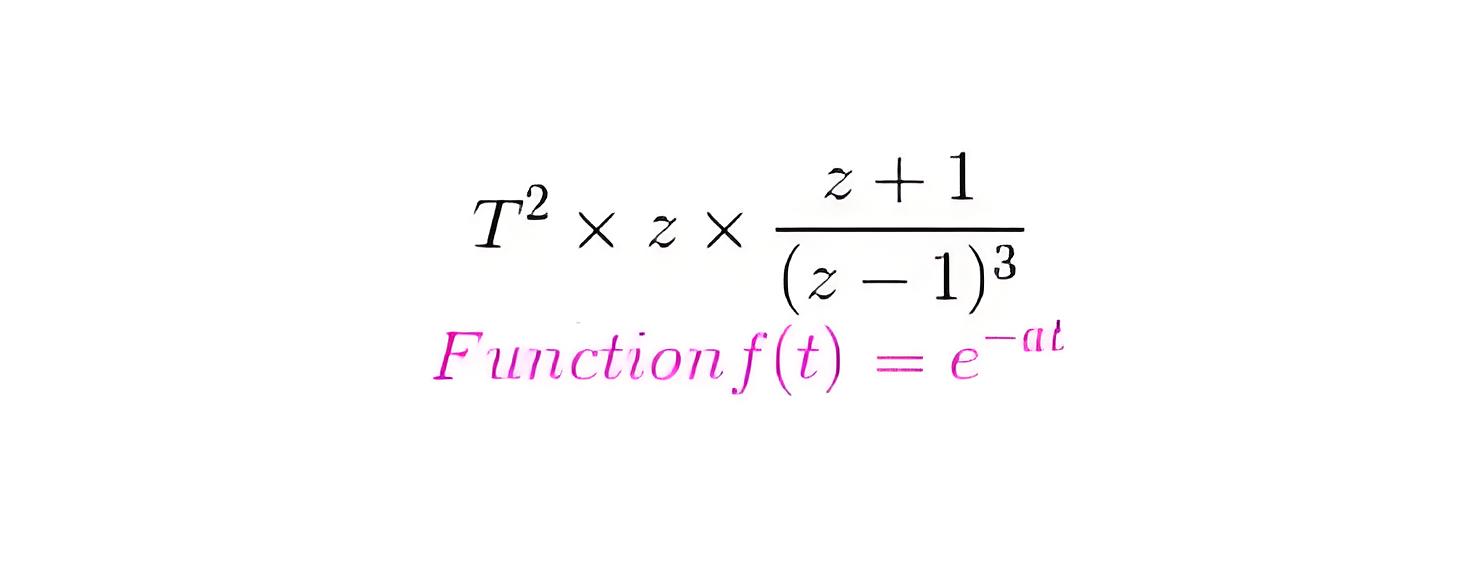
Laplace transformation of this function is 2/s3 and the corresponding f(k) = kT. Now the z transformation of this function is


Laplace transformation of this function is 1/(s + a) and the corresponding f(k) = e (-akT)


02419e0153bb9f6f9a42430e2313be7e.jpeg


Now the z transformation of this function is


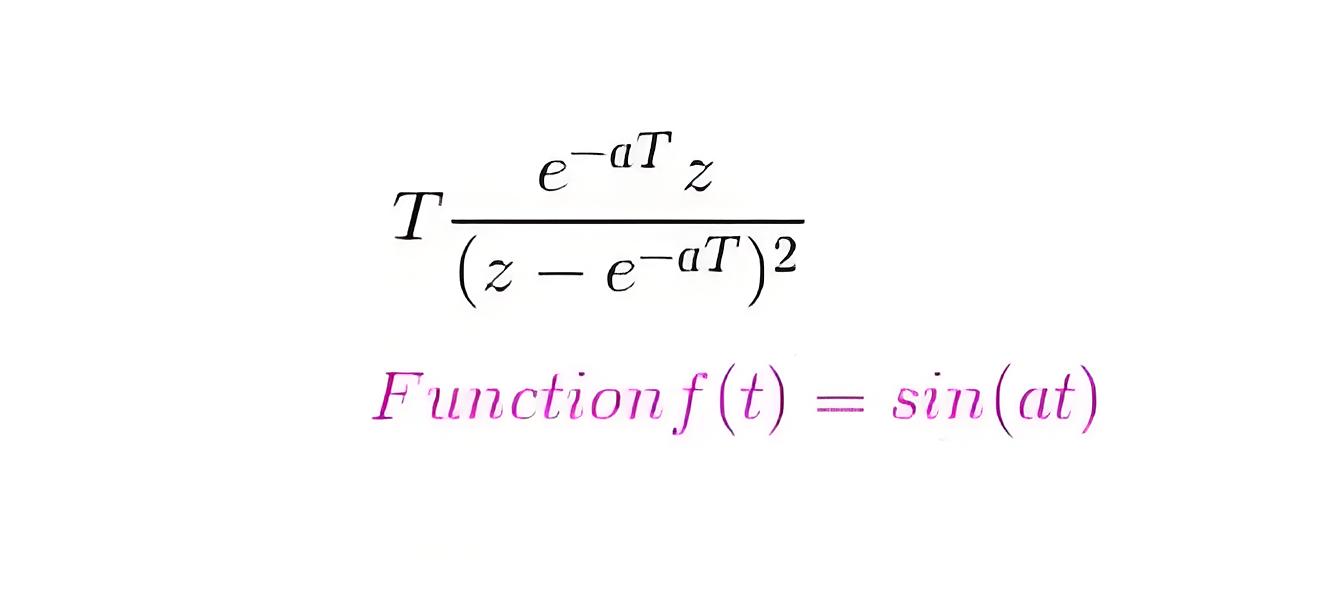
Laplace transformation of this function is 1/(s + a) 2 and the corresponding f(k) = Te-akT. Now the z transformation of this function is


0f3ac2ebb3cb3a2033a80f71b9a66a75.jpeg


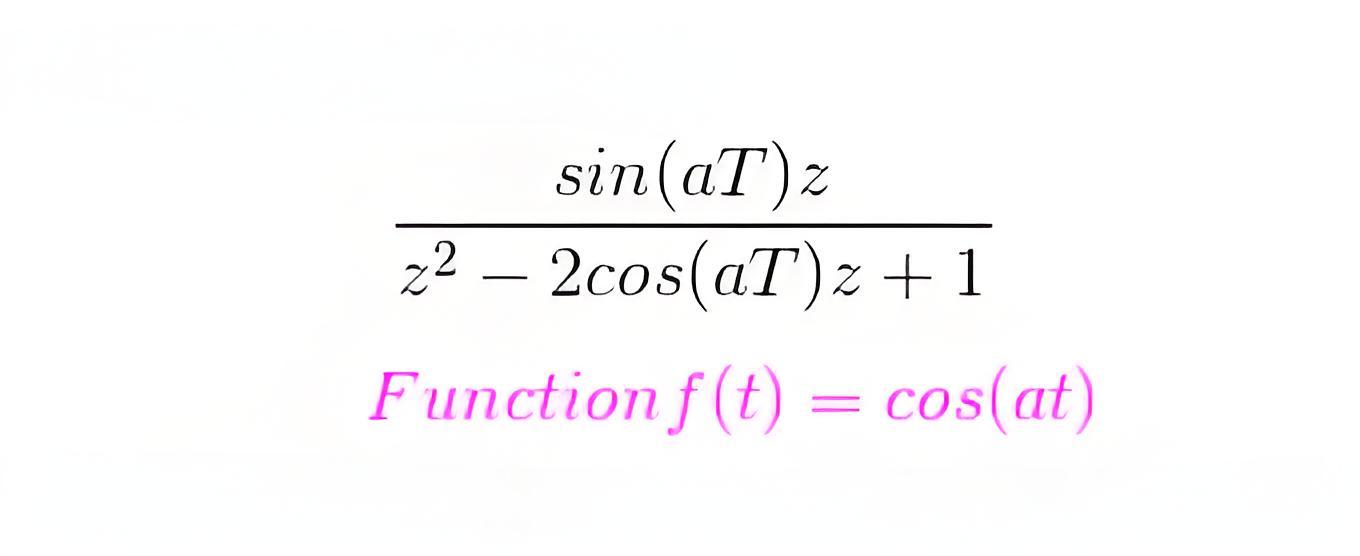
Laplace transformation of this function is a/(s 2 + a2) and the corresponding f(k) = sin(akT). Now the z transformation of this function is


645eb4b7b5305a9935435ee1a2c02dc8.jpeg 

Laplace transformation of this function is s/(s 2 + a2) and the corresponding f(k) = cos(akT). Now the z transformation of this function is


5ad9ceb3e4a165cbd74036853bd1f52a.jpeg


Now sometime there is a need to sample data again, which means converting discrete data into continuous form. We can convert digital data of control system into continuous form by hold circuits which are discussed below:


6df225009b2d9686157a20eba8dc560a.jpeg


Hold Circuits: These are the circuits which converts discrete data into continuous data or original data. Now there are two types of Hold circuits and they are explained in detail:


d070a50c1295d56763b9ccb2fdcc9d01.jpeg


Zero Order Hold Circuit


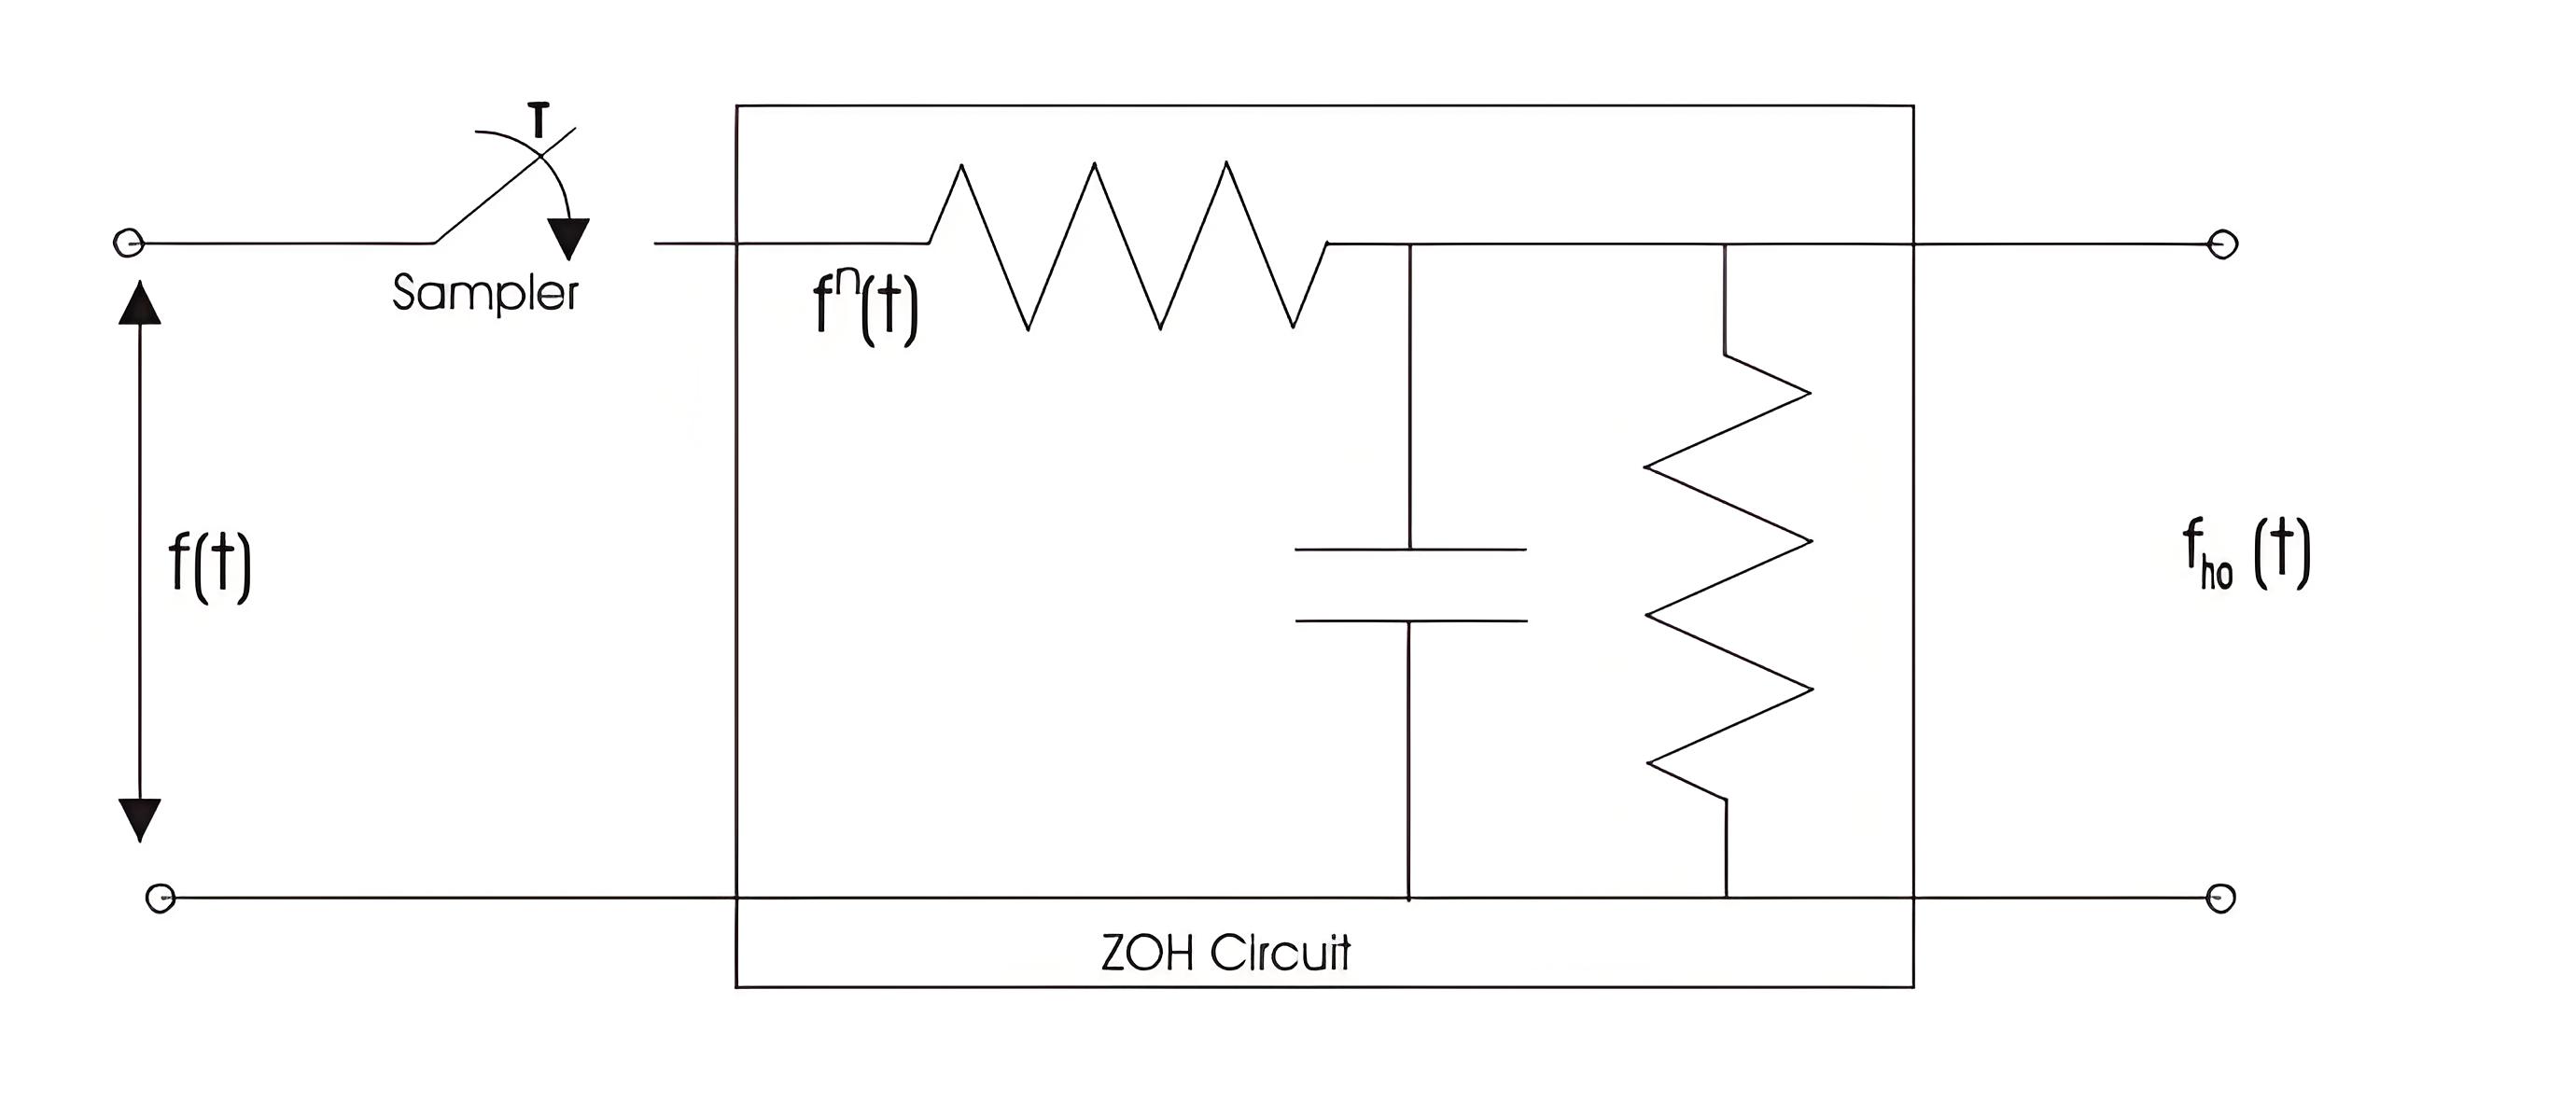
The block diagram representation of the zero order hold circuit is given below:


Figure related to zero order hold.


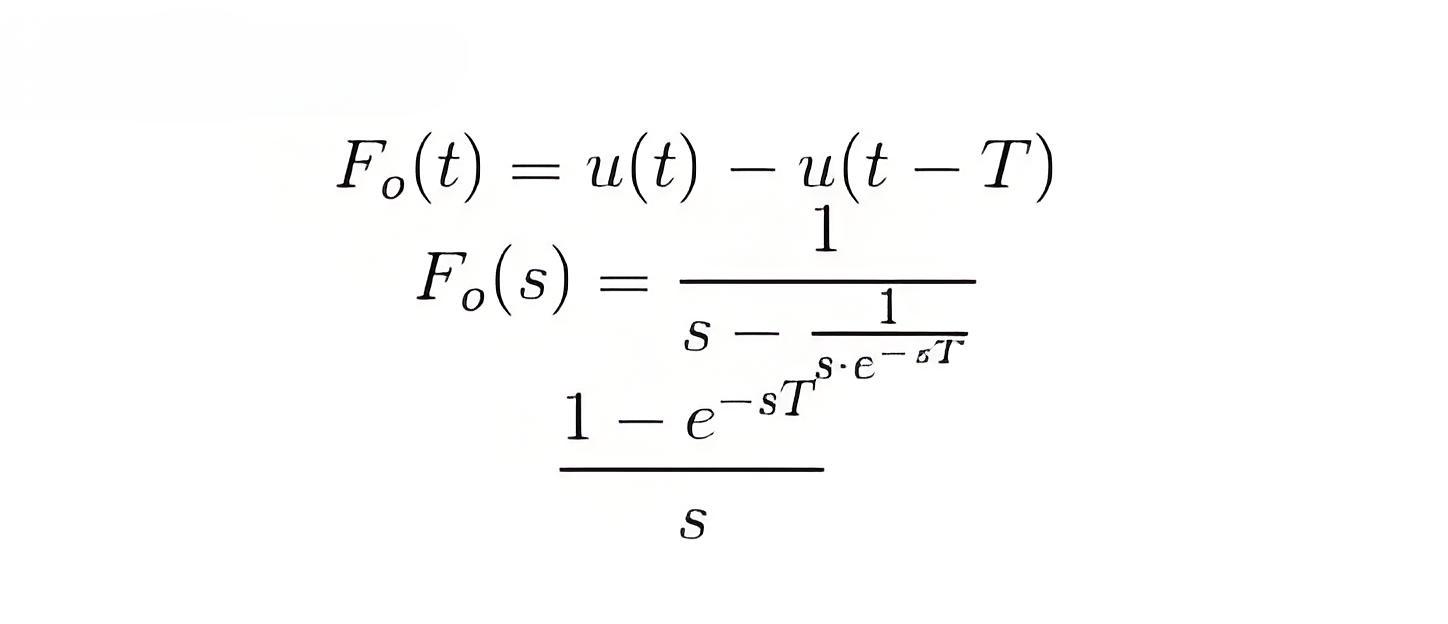
In the block diagram we have given an input f(t) to the circuit, when we allow input signal to pass through this circuit it reconverts the input signal into continuous one. The output of the zero order hold circuit is shown below.Now we are interested in finding out the transfer function of the zero order hold circuit. On writing the output equation we have


on taking the Laplace transform of the above equation we have


From the above equation we can calculate transfer function as


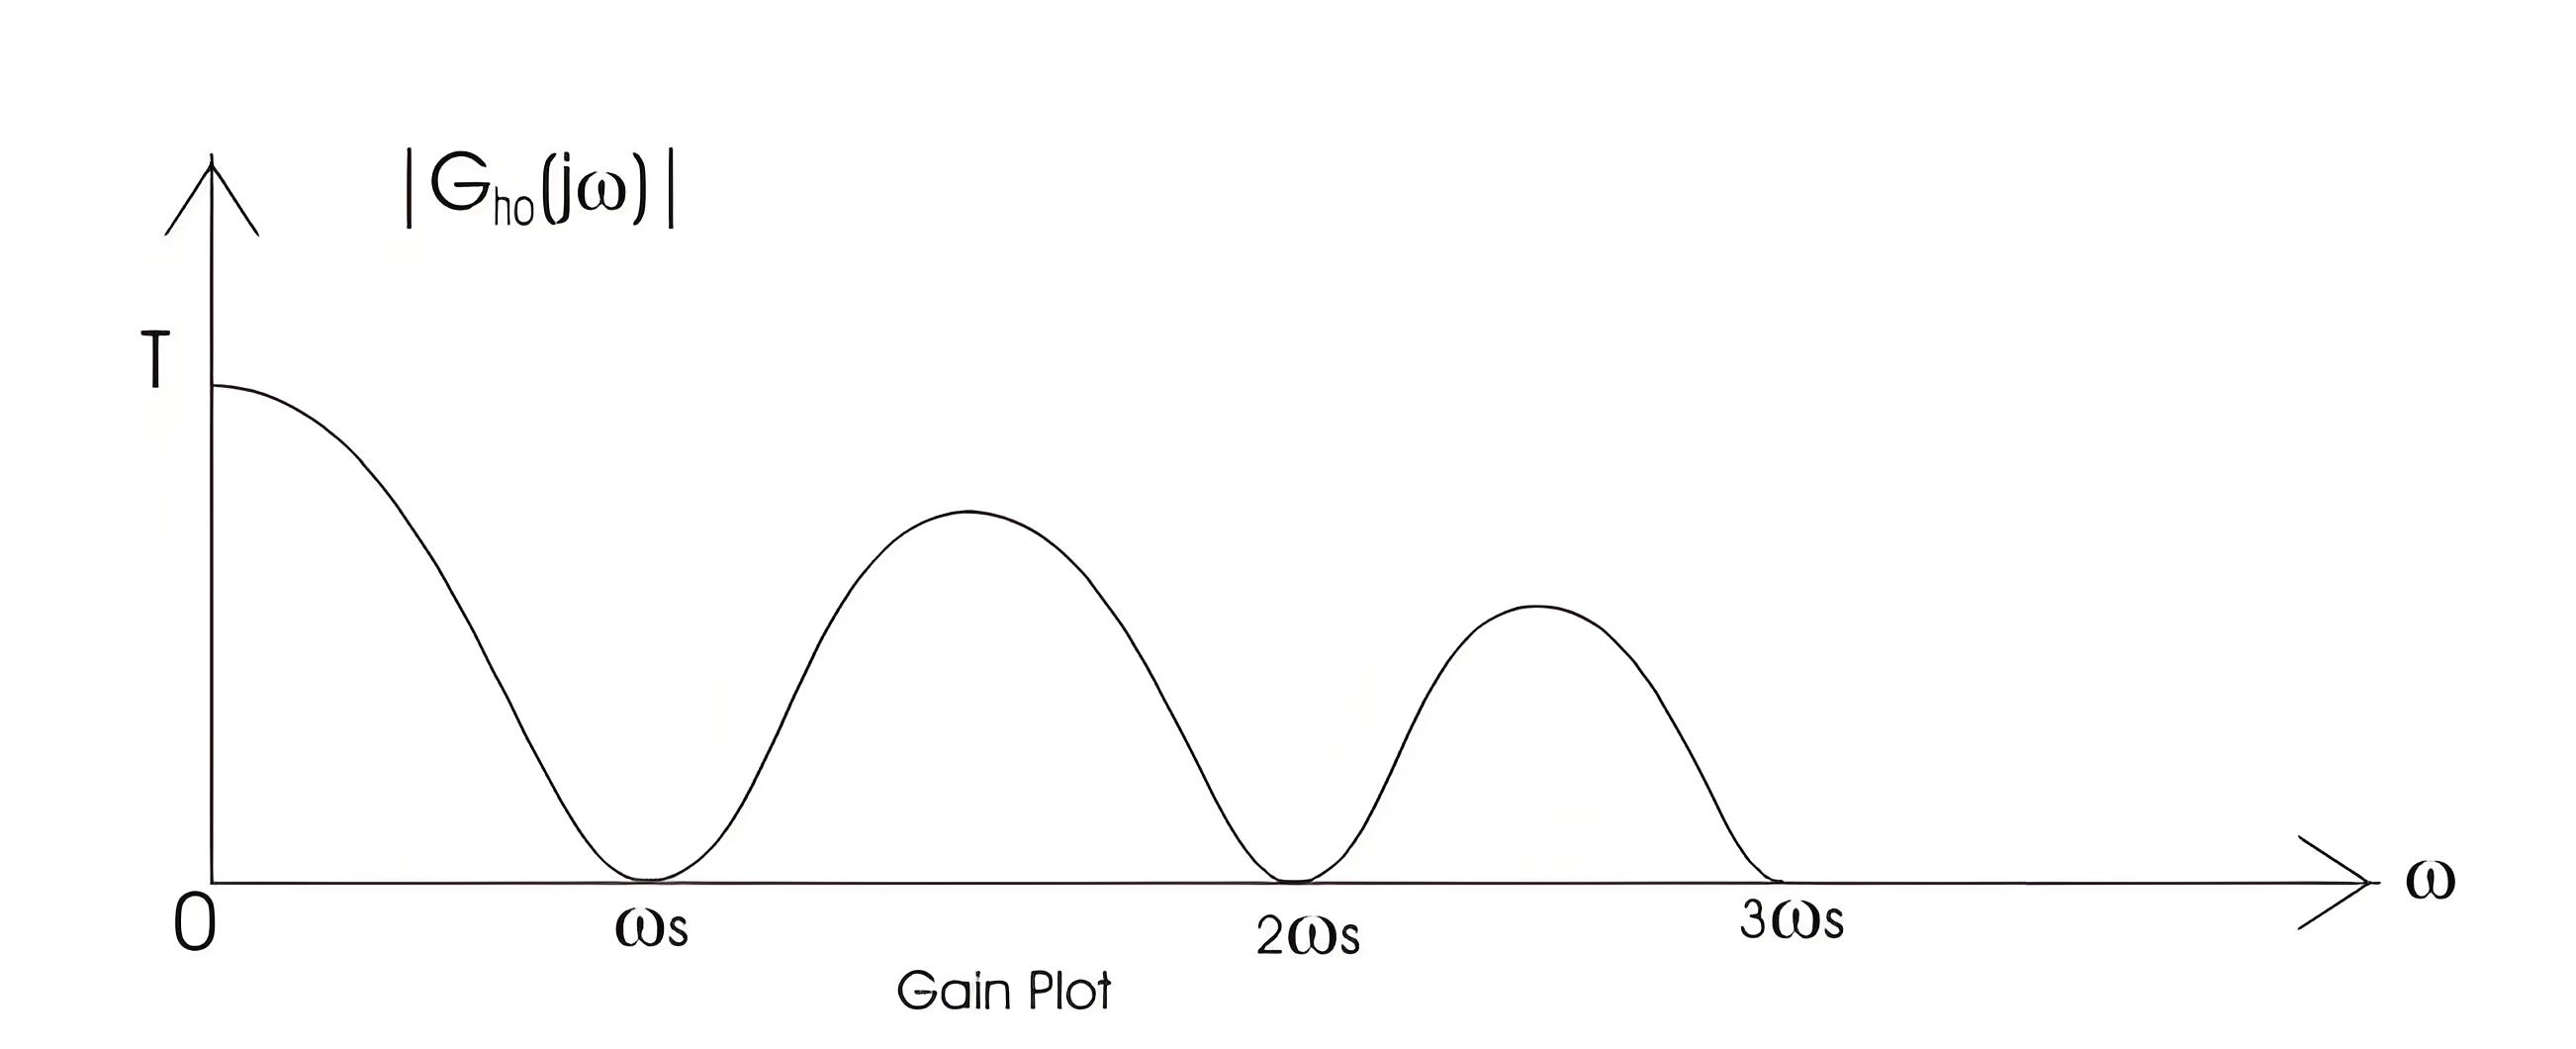
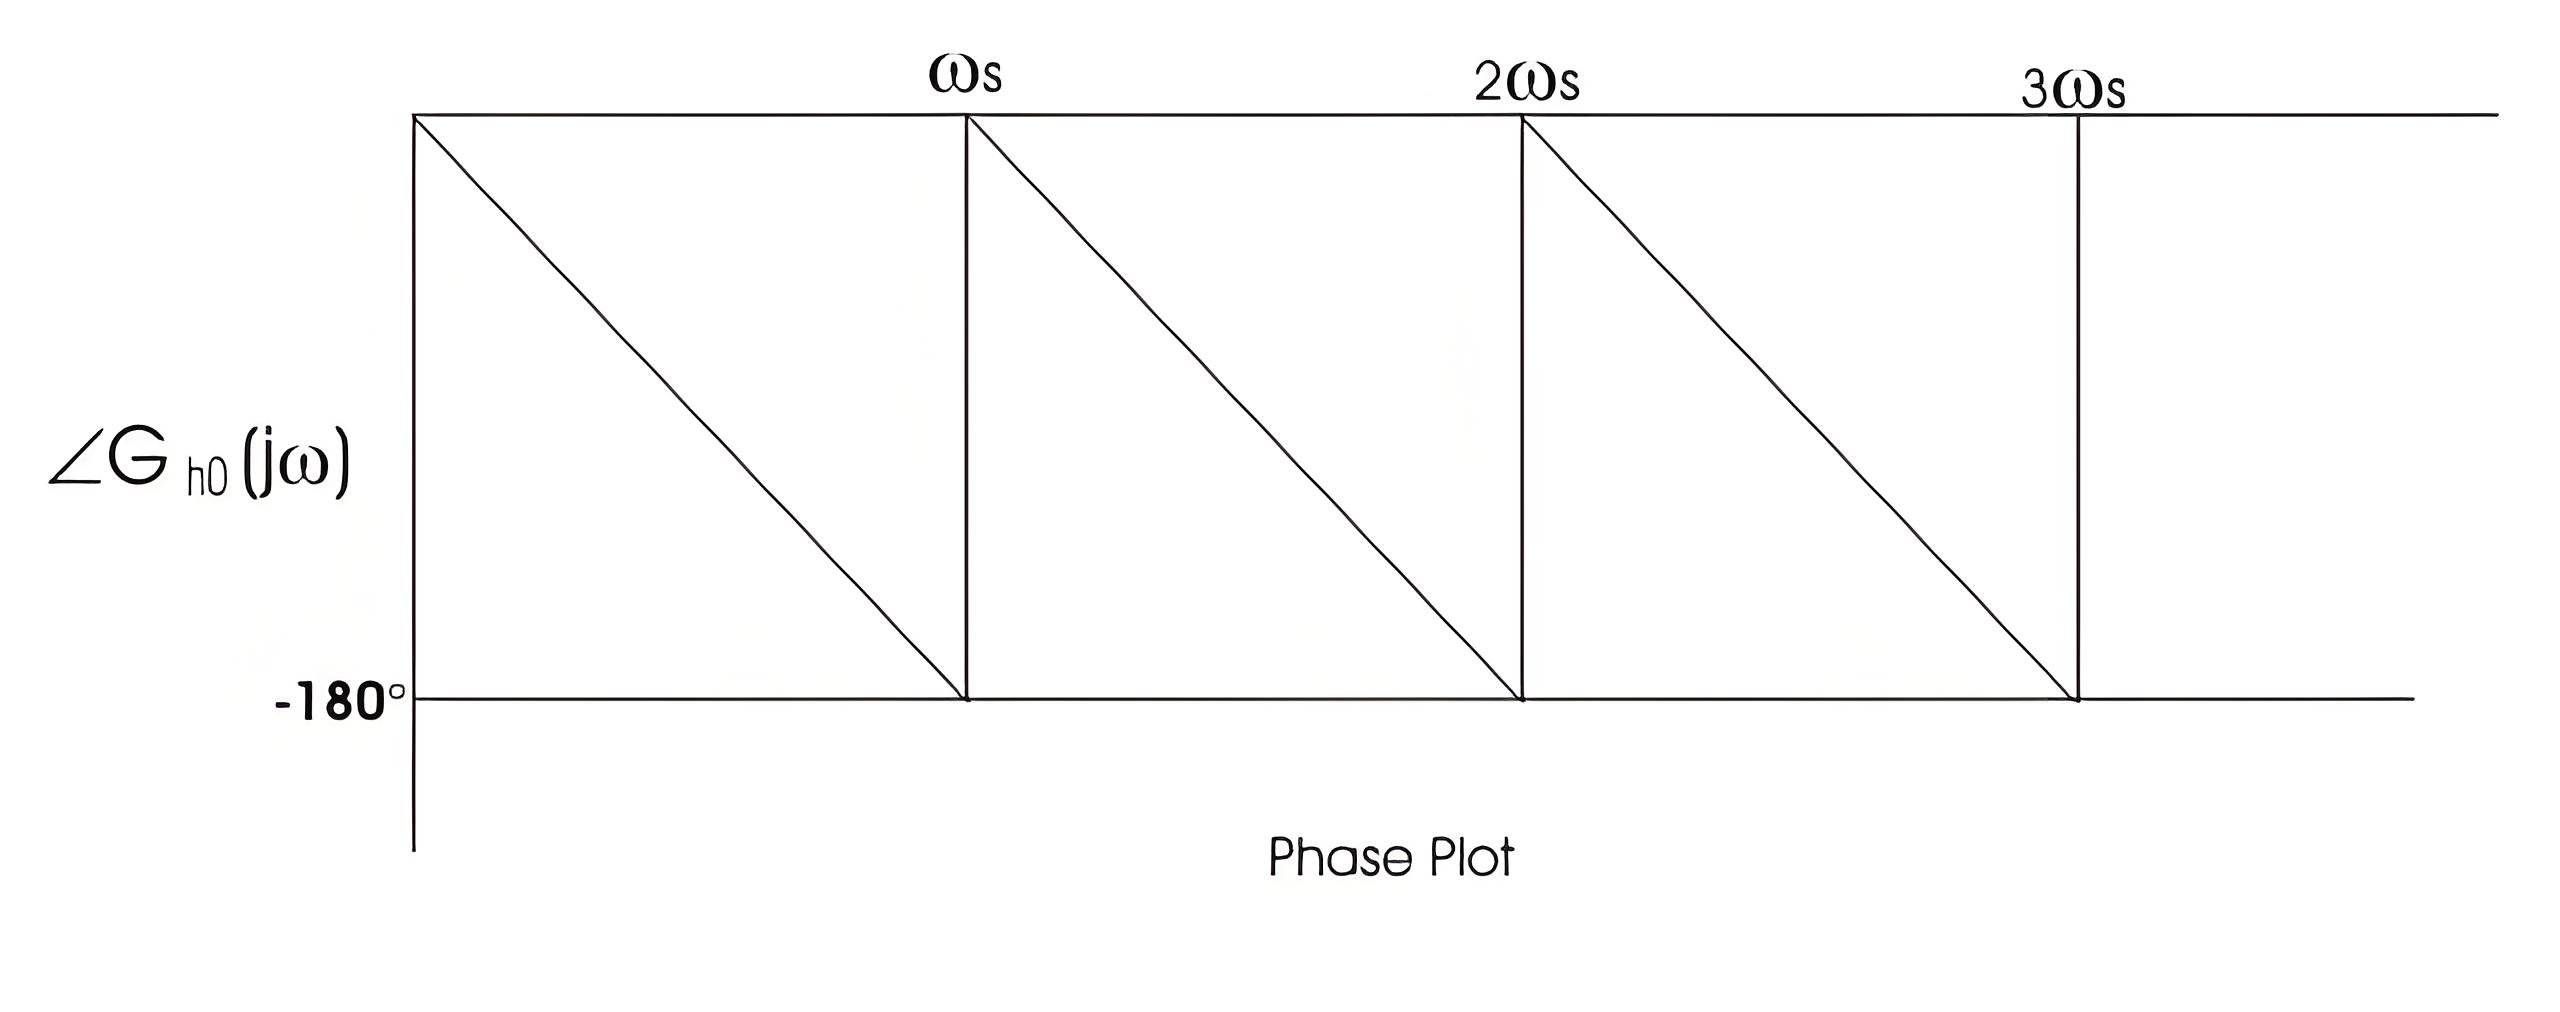
On substituting s=jω we can draw the bode plot for the zero order hold circuit. The electrical representation of the zero order hold circuit is shown below, which consists of a sampler connected in series with a resistor and this combination is connected with a parallel combination of resistor and capacitor.


82d9b95ea45a7beefba09102f61dee5e.jpeg


4f0c57162ab2b3168764981267f560fd.jpeg


GAIN PLOT – frequency response curve of ZOH


PHASE PLOT – frequency response curve of ZOH


94c6b68814e6ce572be54c71eaa4abb6.jpeg


First Order Hold Circuit


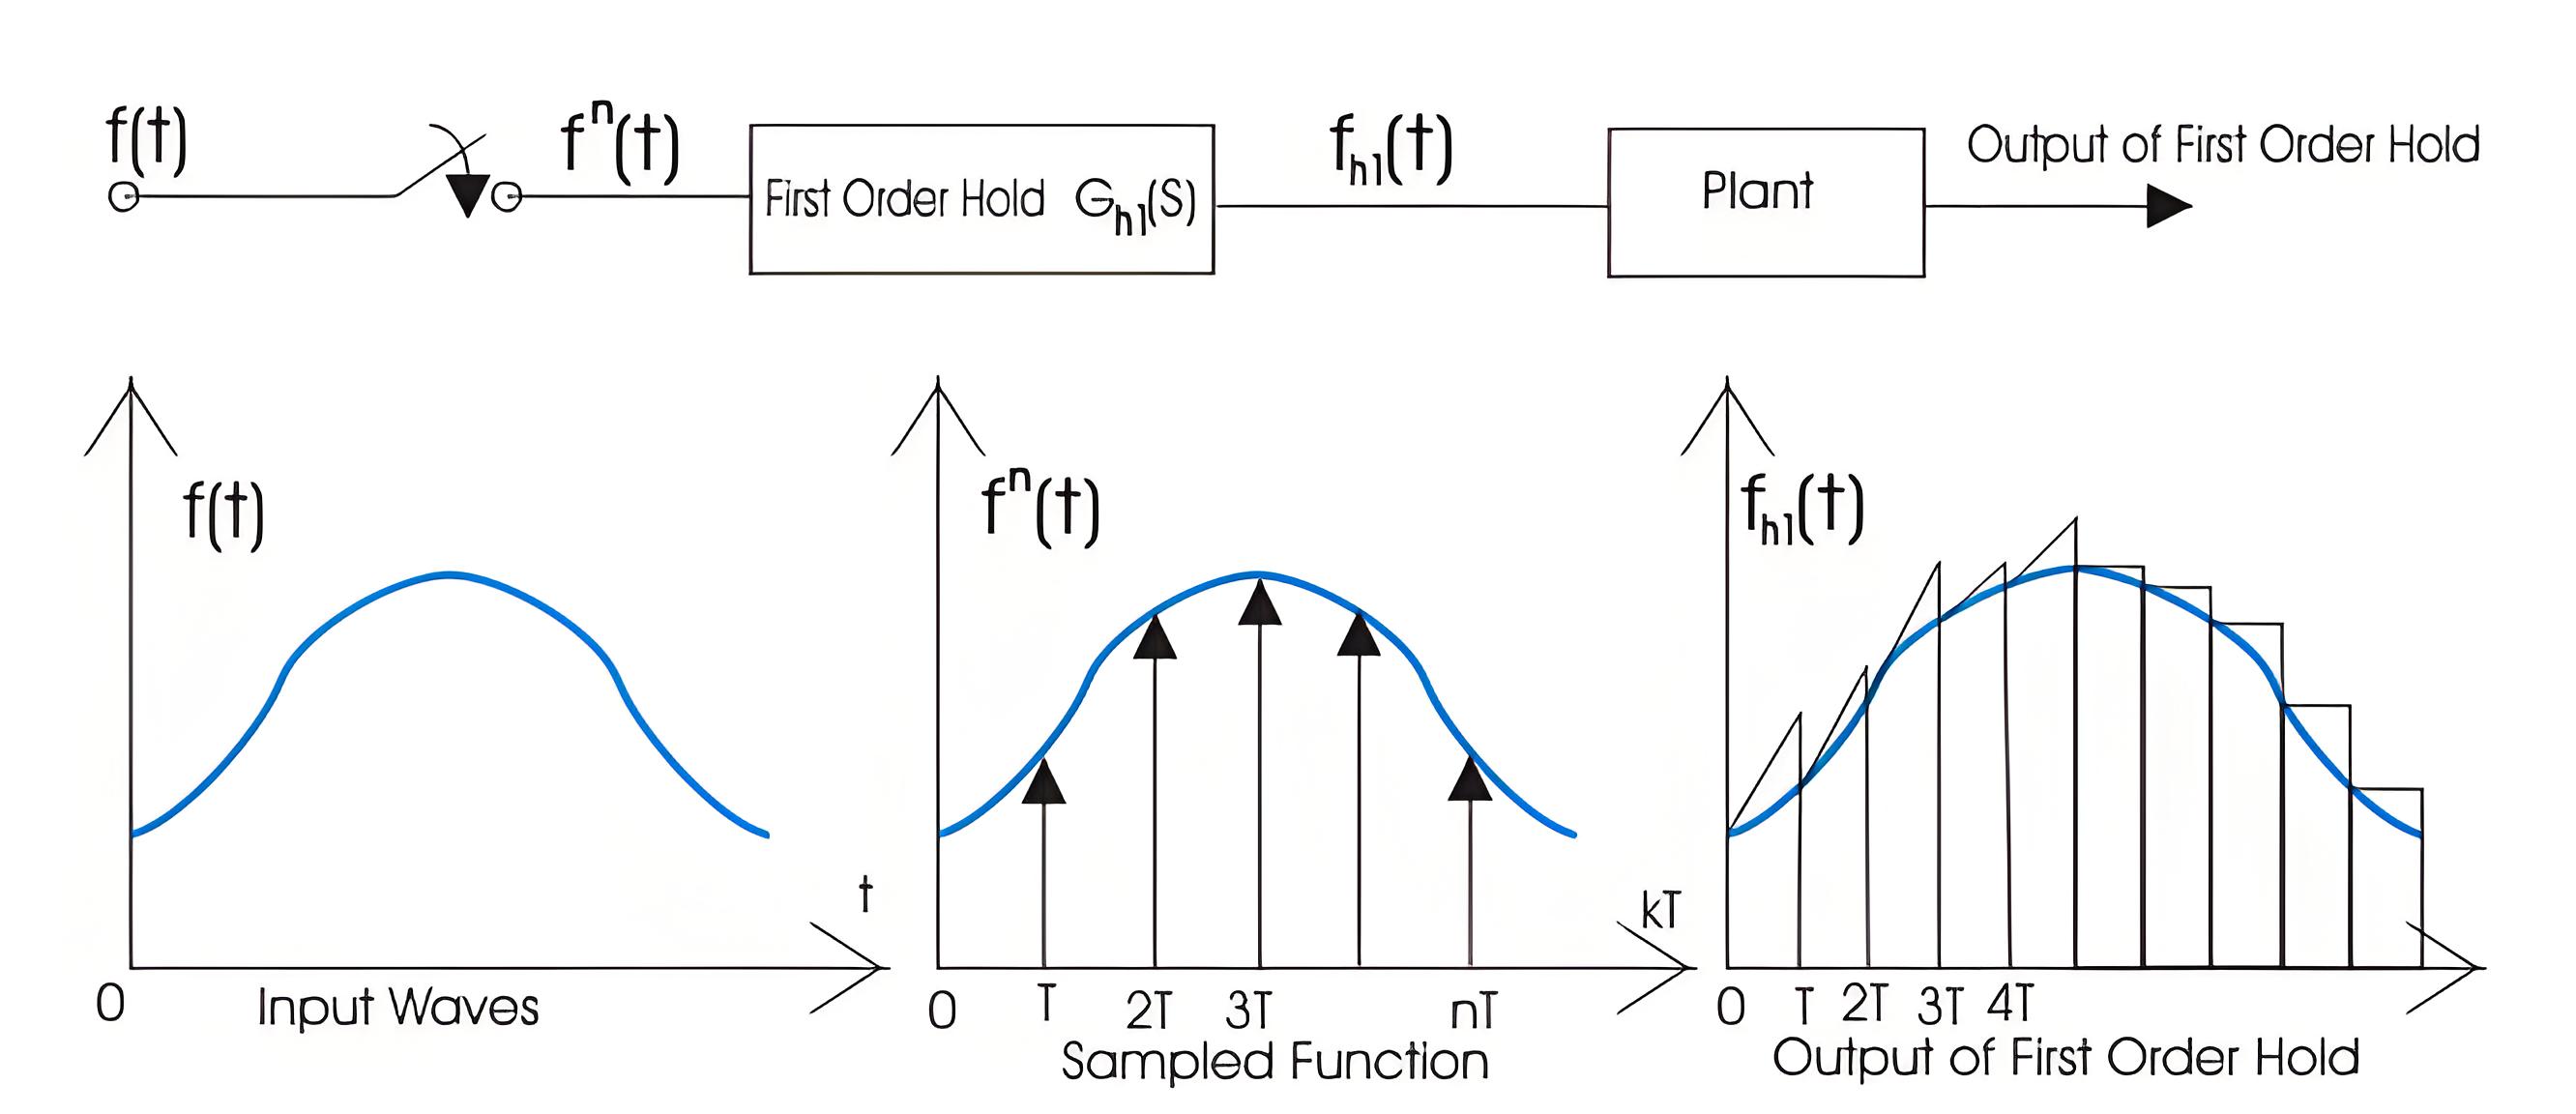
The block diagram representation of the first order hold circuit is given below:


6d068747957f67af0f2c92f60b032440.jpeg


First Order Hold Circuit


In the block diagram we have given an input f(t) to the circuit, when we allow input signal to pass through this circuit it reconverts the input signal into continuous one. The output of the first order hold circuit is shown below: Now we are interested in finding out the transfer function of the first order hold circuit. On writing the output equation we have


On taking the Laplace transform of the above equation we have


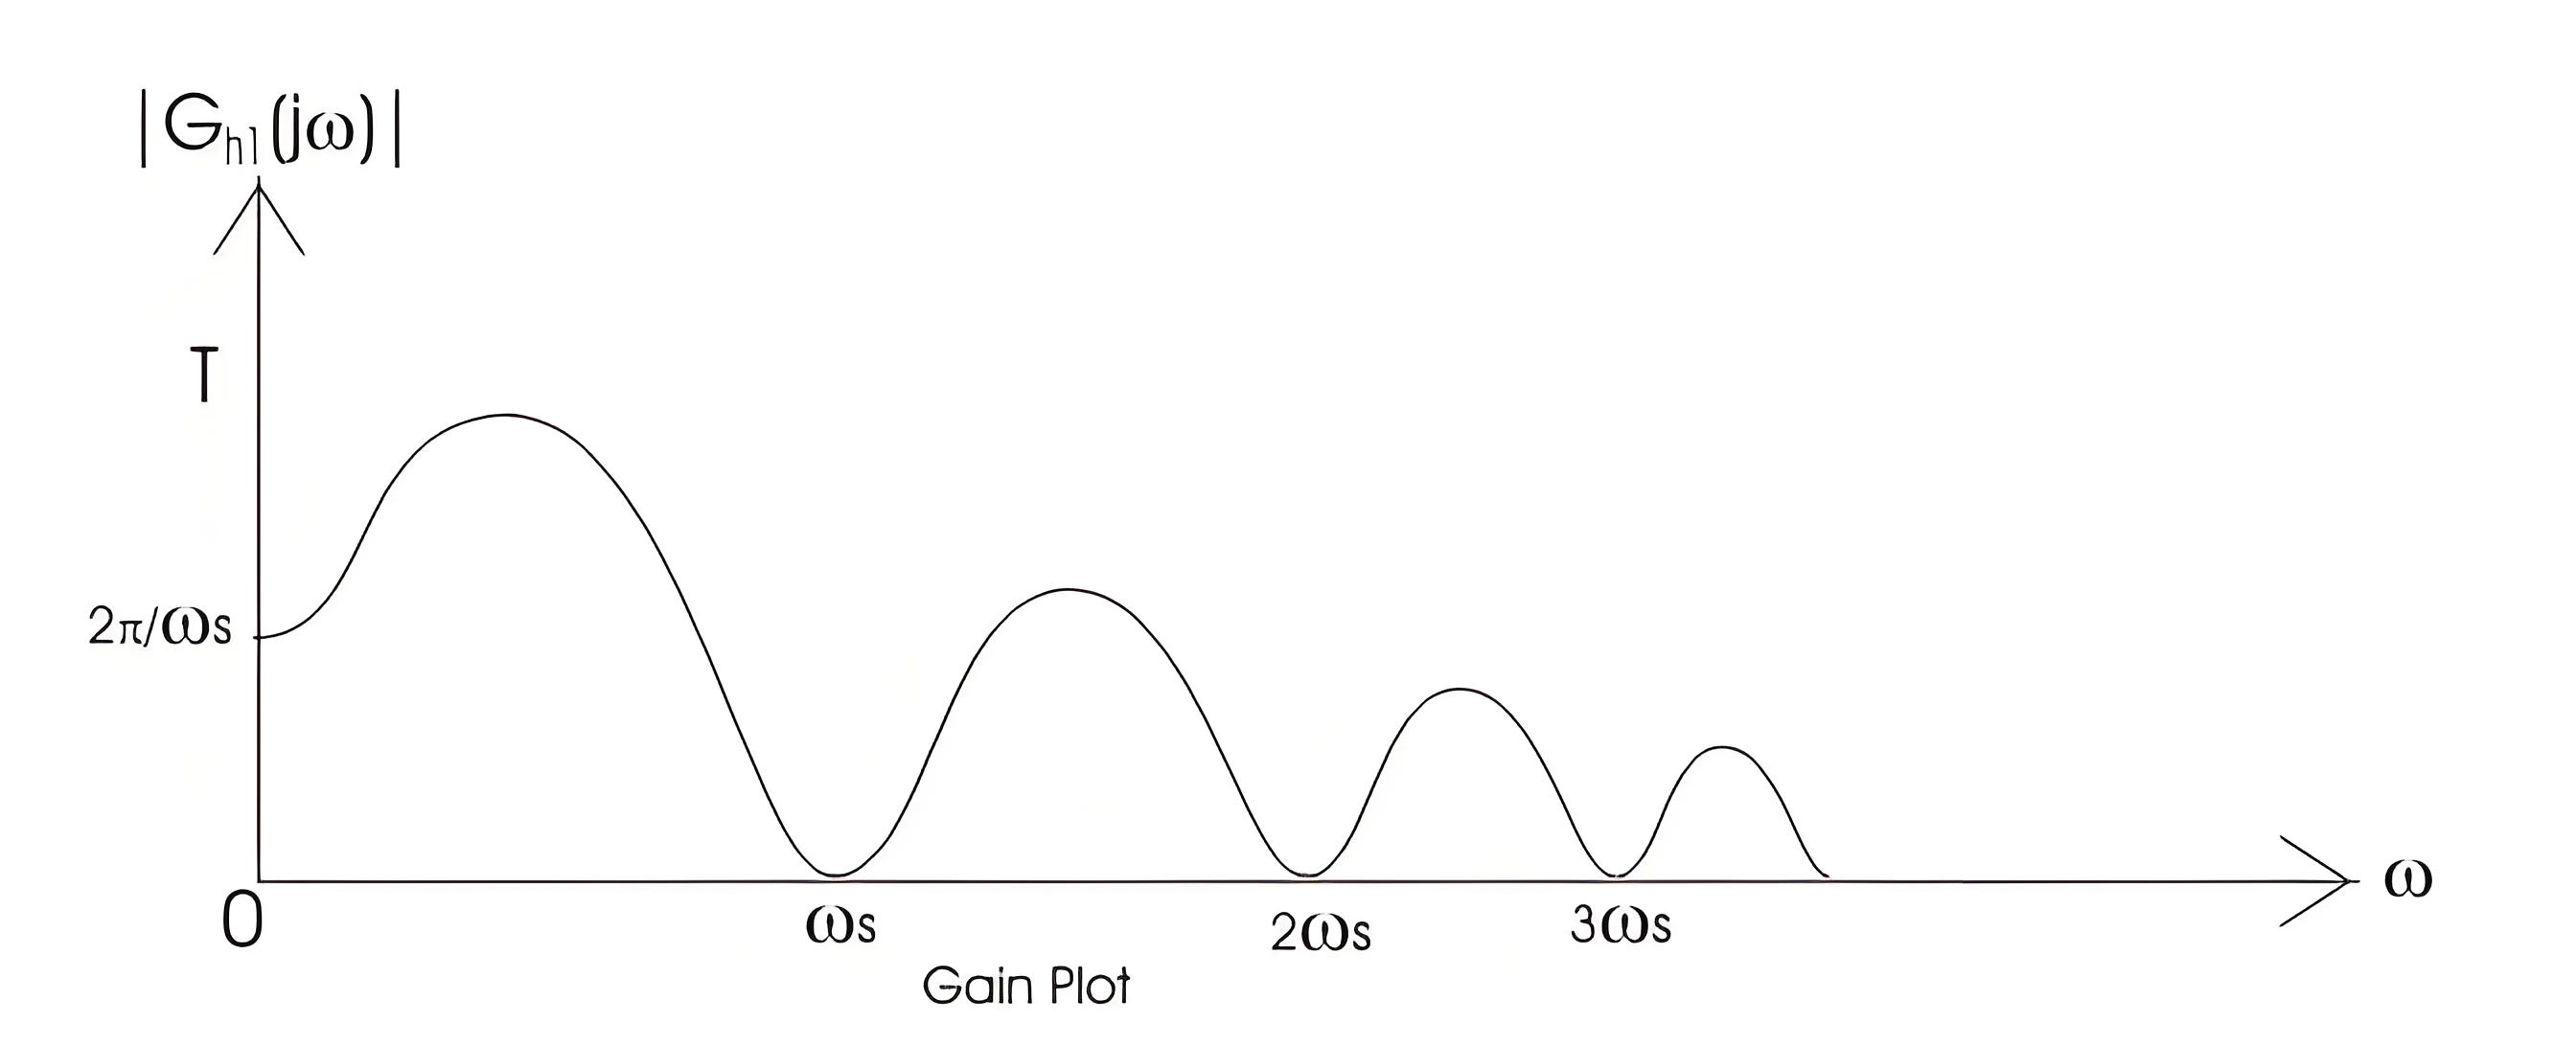
From the above equation we can calculate transfer function as (1-e -sT)/s. on substituting s=jω we can draw the bode plot for the zero order hold circuit.


The bode plot for the first order hold circuit is shown below which consists of a magnitude plot and a phase angle plot.The magnitude plot starts with magnitude value 2π/ωs.


c3547f4d1c2c672c274906d6ff3cb35d.jpeg


The Electricity Encyclopedia is dedicated to accelerating the dissemination and application of electricity knowledge and adding impetus to the development and innovation of the electricity industry.

What is the difference between a dielectric and an insulator?
Dielectrics and insulators are distinguished primarily by their applications. One of the main differences is that a dielectric can store electrical energy by becoming polarized in an electric field, whereas an insulator resists the flow of electrons to prevent current conduction. Other key differences between them are outlined in the comparison chart below.Definition of DielectricA dielectric material is a type of insulator that contains few or no free electrons. When subjected to an electric fi
08/30/2025
Transformer Connection Sections
Transformer Connection DesignationsThe transformer connection designation indicates the winding connection method and the phase relationship between the line voltages of the primary and secondary windings. It consists of two parts: letters and a number. The letters on the left denote the connection configurations of the high-voltage and low-voltage windings, while the number on the right is an integer from 0 to 11.This number represents the phase shift of the low-voltage winding's line voltage r
08/15/2025
Automatic Reclosing Scheme in Transmission Systems
Automatic Reclosing Scheme for Transmission SystemsThe automatic reclosing system is a series-connected network designed to reduce operating costs and enhance network reliability. Extra-high voltage (EHV) transmission lines are used to transmit large amounts of power, on the order of thousands of megawatts (MW), and therefore should not be interrupted at all costs. Although faults on these overhead lines are common, the power transmitted through them should not be interrupted for long periods du
08/07/2025
Transformer operation and maintenance
Transformer Operating TemperatureDuring operation, transformers generate copper losses and iron losses, both of which are converted into heat, causing the transformer’s temperature to rise. Most transformers in China use Class A insulation. Due to heat transfer characteristics, significant temperature differences exist between different components during operation: winding temperature is the highest, followed by the core, and then the temperature of the insulating oil (with upper-layer oil being
07/31/2025
Inquiry
Download
IEE-Business is dedicated to serving the personnel in the global power industry.
Join IEE-Business, not only can you discover power equipment and power knowledge, but also canhnd like - minded friends!