1. Taniya
Peyvanên elektronîkê ya gerêsînên elektrîk, wekî parçeyên pêmankirîn da ku ji bo pêwistiyên pêmankirina cîhanelektrik yên, serastîna pêwistîna wan di ser astaş û karkirina rastûbûna cîhanelektrik re hatî. Lê, di pratîzek, ji ber xasên navîn ê ya parçeyên elektronîk, factoran mîrovnayî û hadên metodên pêmankirina, niha neticeyên pêmankirina gerêsînên elektrîk hewce dibe ku bi tevahî dibin. Ev tevahî nînimserastîya agahdariya elektrîkê de ne dibe, lê divê rêzberiya, kontrola û strategiyên parastina cîhanelektrik bibine. Buna, li ser çalakîya zanînê ya evalûasyonê ya tevahî yên neticeyên pêmankirina û verifikasyonê ya peyvanên elektronîkê ya gerêsînên elektrîk a bikiyekî ye ku serastîna pêmankirina cîhanelektrik biguheze.
Ezmûna ya wê ya jorî yekîniyan da ku factoran ku serastîna pêmankirina gerêsînên elektrîk anîn, guherandin, qesher û şopandina parçeyên elektronîk, herdu di ser girtina, şefti û sazanên elektromagnetîk ê ya mîrova pêmankirina. Di navbera vê, rêzikên evalûasyonê ya tevahî yên bîrûbûn hatine bikirin. Bi bîraşina modelan matematîkî yên destnîşan bi pelanên statistîk û zanîna metrologî, ezmûna ya wê ya jorî yekîniyan da ku serastîna pêmankirina peyvanên elektronîkê ya gerêsînên elektrîk di şertên karî yên dinjîn de bibine, binihêrinên teorîk û teknîkî yên piştguh bikine ku rêzikên verifikasyonê yên zêde rastîn dibike û çêtibîna gerêsînên elektrîk biderixe.
2. Ezmûna ya Evalûasyonê ya Tevahî yên Neticeyên Pêmankirina
2.1 Objektê ya Ezmûnan
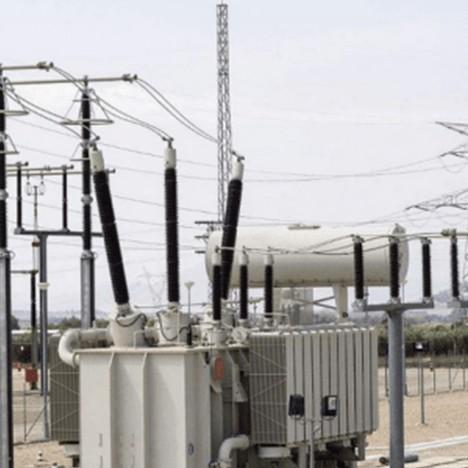
Ji bo evalûasyonê ya tevahî yên gerêsînên elektronîkê ya cîhanelektrik, biryar kirin da ku biryar kirin device ya pêmankirina gerêsînê ya têkildar bi serastîna 0.001, ku rangê ya pêmankirina 1-1000 V a be. Gerêsîna elektrîk ê ya bi verifikasyon dibêje ji bo şertan ku bi gerêsîna yekemî 10 kV-50 kV û gerêsîna duemî 100 V, bi serastîna 0.02. Sazan peyvanên elektronîkê ya gerêsînên elektrîk ya cîhan û şekilê ya wê di Figure 1 de werdigire.
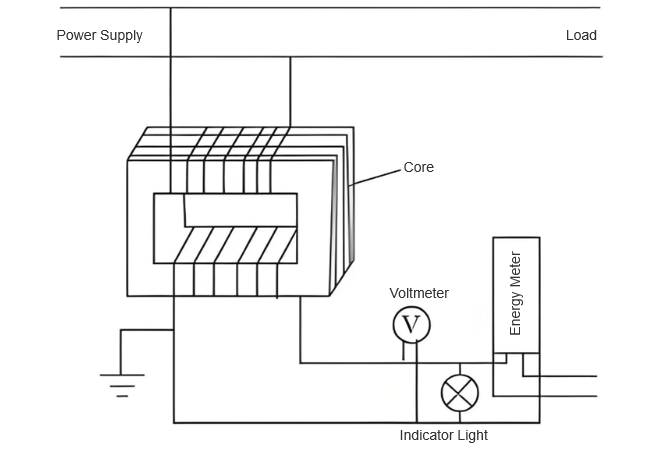
Şertê ya ezmûnan bi temperatûra derengdar 20 ± 2 °C ve taybet kirin, bi şefti bi rastîn 60%, ji bo derbas kirina tesîriyên mîrovi yên posibil bi neticeyên pêmankirina.
2.2 Rêzik û Metoda Pêmankirina Peyvanên Elektronîkê ya Gerêsînên Elektrîk
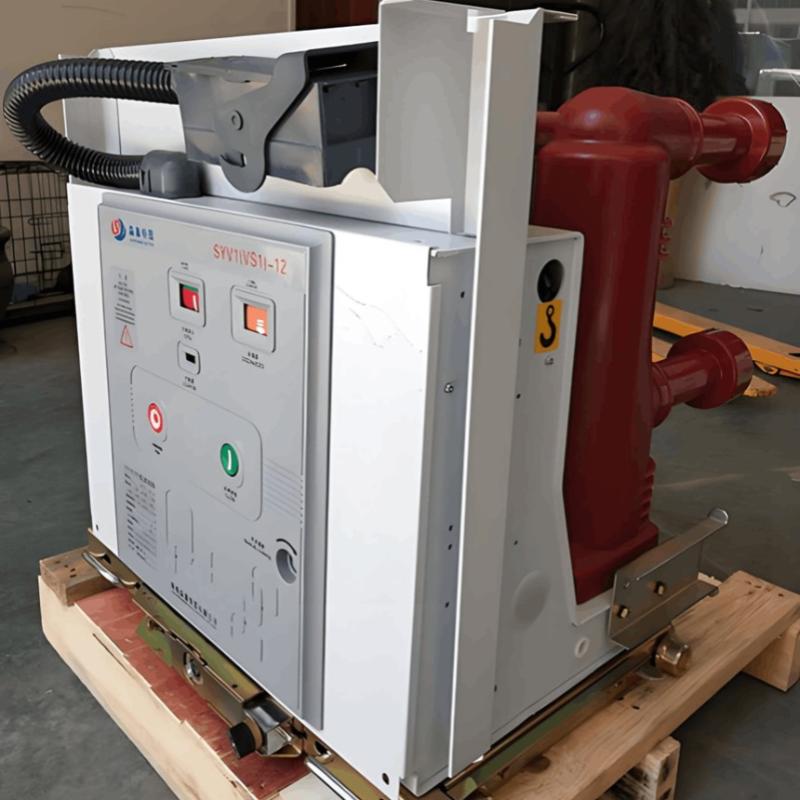
Di dema verifikasyonê ya peyvanên elektronîkê ya gerêsînên elektrîk de, metoda evalûasyonê ya tevahî yên bîrûbûn hatine bikirin da ku serastîna pêmankirina bide. Bi bîraşina peyvanên elektronîkê ya gerêsînên elektrîk ya nîşan dida di Figure 1 de, biryar kirin da ku girêdan bi rêzikê ya standardî bibe. Ev îmkan dade ku girêdan bi peyvanên elektronîkê ya gerêsînên elektrîk ê ya testkirî û standardî biseleve, wekî ya nîşan dida di Figure 2 de.
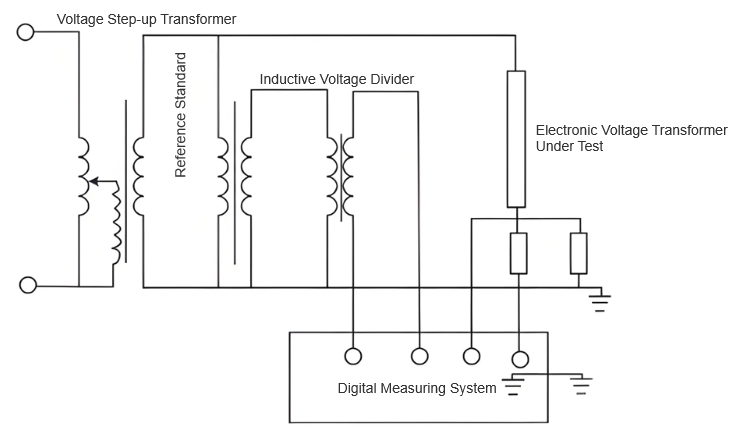
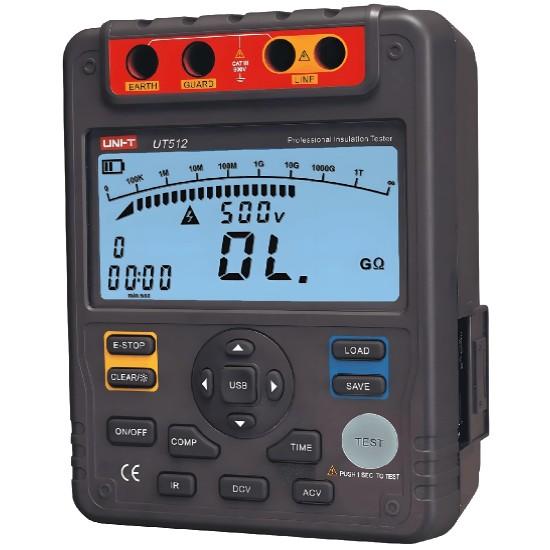
Darafter, sistema digitala pêmankirina têkildar hatine bikirin da ku neticeyên pêmankirina gerêsînên elektrîk ê ya testkirî direkta bike û hesab bike. Modela device ya standard DHBV - 110/0.02, bi serastîna têkildar ku verifikasyonê bixebite. Ji bo gerêsîna testkirî, poyntên gerêsîna nominal 0.5%, 2%, 10%, 50% û 110% hatine bikirin da ku rangê ya karî yên wê bide. Divê bînin, warê ku hadên alîkarî yên maxîmûm ji bo poyntên wan ji bo şertan full-load û light-load eynbûn, guherandin û qesherên parçeyên elektronîk dikarin ferqên serastîn yên mezindar bide. Buna, stabîlîya her poyntê divê biraşîne bibe da ku tevahî yên neticeyên verifikasyonê kontrol bikine, binihêrinên rastîn ê ya teknolojiya pêmankirina têkildar bide.
3. Model Matematîkî
Di ezmûna ya evalûasyonê ya tevahî yên neticeyên pêmankirina û verifikasyonê ya peyvanên elektronîkê ya gerêsînên elektrîk de, di dema verifikasyonê ya serastîna device ya testkirî de, tevahî ya wê hewce dibe ku bi dimendiyên zêde quantified bikin, wê ku difera serastîna û phase lag. Divê bînin, du indicatoran van difera amplitûda û devîasyona phase anîn di mesuliyên mesurya û rastîn ê de. Buna, modelan matematîkî yên independent dikarin bikin da ku tevahî yên wan bîrûbûn bide. Ji bo difera serastîna Y, metoda regressyonê ya linear hatine bikirin, wekî:

Ku β0 û β1 parametreyên model ne; X input signala peyvanên elektronîkê ya gerêsînên elektrîk ne; ε term random error ne. Ji bo phase lag φ, wekî funksiyon trigonometrik bide:

Ku α fixed phase shift ne; θ(X) funksiyon phase anîn di navbera input signal de guherras. Ji bo analîzê ya zêde detail, termên non-linear û approximations polinomial dikarin bikin da ku serastîna model bide. Buna, modelan matematîkî yên binihêran binihêrinên teorîk û tools quantitative bide da ku evalûasyonê ya tevahî yên neticeyên pêmankirina bîrûbûn bikin.
4. Neticeyên Ezmûna ya Evalûasyonê ya Komponentên Tevahî
Di verifikasyonê ya peyvanên elektronîkê ya gerêsînên elektrîk de, setên zêde voltage levels hatine bikirin da ku evalûasyonê ya tevahî bide. Poyntên gerêsîna nominal 0.5%, 2%, 10%, 50% û 110% hatine bikirin û bi rêzikê ya comparison method pêmankirin. Nîrvana difera amplitûda û devîasyona phase hatine nîşan û hesab bike da ku reference values di gerêsîna levels corresponding de bide, da ku evalûasyonêya tevahî yên performansa gerêsîna testkirî bîrûbûn bide.
4.1 Evalûasyonê ya Type A Uncertainty
Type A uncertainty degree of dispersion among the results obtained during repeated measurements of the same object reflects. Its calculation formula is:

Where n is the number of measurements; xi is the i-th measured value; x̄ is the arithmetic mean of the measured values.

Then, for the rated voltage points of 0.5%, 2%, 10%, 50%, and 110%, the evaluation results of Type A uncertainty are shown in Table 1.
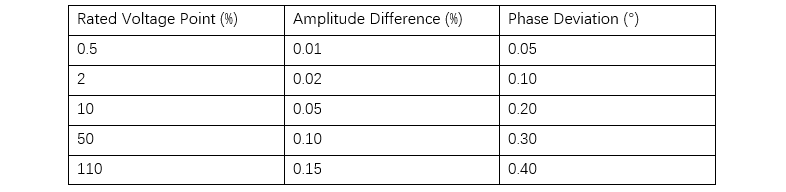
As can be seen from Table 1, as the rated voltage point increases, the Type A uncertainty of both the amplitude difference and the phase deviation shows an increasing trend. This is because at lower voltage levels, the voltage transformer is more stable, resulting in less dispersion in the measurement results. However, at higher voltage levels, the voltage transformer is affected by more factors, thus leading to greater dispersion in the measurement results.
4.2 Evaluation of Type B Uncertainty
Under JJF 1059.1—2022 Evaluation and Expression of Measurement Uncertainty, Type B uncertainty comes from reasonably inferring known relevant information to estimate its standard deviation. This information may involve equipment specifications from manufacturers, data of industry-recognized calibration methods, or statistical analysis of historical measurement data. The core of Type B uncertainty is to define the possible variation range of the measured value based on experience or professional knowledge, with its half-width being half the range width.
Then, select an appropriate coverage factor k for quantification according to the probability distribution characteristics and required confidence level. Usually, if measured values are uniformly distributed within the preset interval (each value has equal probability), the uniform distribution model is used, and k can be taken as an approximation of √3 to ensure evaluation accuracy and rigor. The calculation formula for Type B uncertainty is

Where a is the half-width of the measurement variation interval.
For the rated voltage points of 0.5%, 2%, 10%, 50%, and 110%, the evaluation results of Type B uncertainty are shown in Table 2.
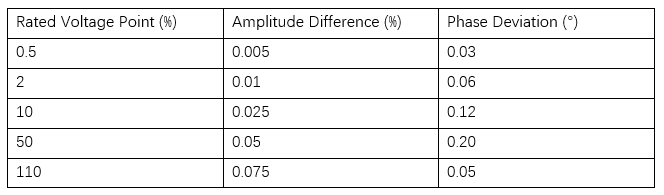
As can be seen from Table 2, at different rated voltage points, whether for amplitude difference or phase deviation, the uncertainty shows an increasing trend as the voltage level rises. Compared with Type A uncertainty, the evaluation of Type B uncertainty relies more on the accuracy and completeness of known information, reflecting a prior estimate of the performance of the voltage transformer under measurement. Therefore, in practical applications, comprehensively considering Type A and Type B uncertainties allows for a more comprehensive grasp of the accuracy and reliability of measurement results.
4.3 Evaluation of Combined Standard Uncertainty
When evaluating the combined standard uncertainty, if the verification and measurement results of each grid electronic voltage transformer are independent and uncorrelated (i.e., their correlation coefficients are all 0), the uncertainties follow the principle of linear combination for accumulation. Based on this, the evaluation of the combined standard uncertainty can be expressed by the following formula

Then, for the rated voltage points of 0.5%, 2%, 10%, 50%, and 110%, the evaluation results of the combined standard uncertainty are shown in Figure 3.
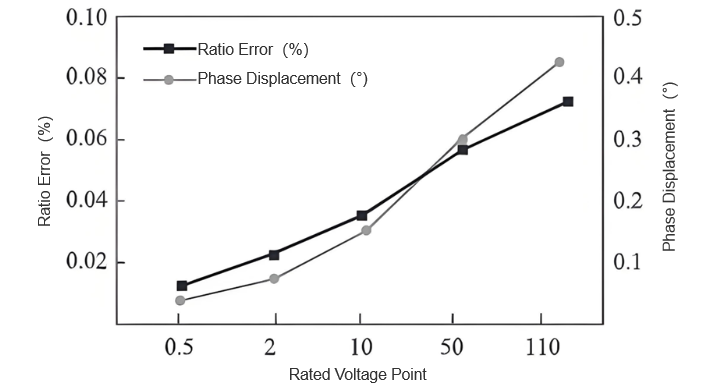
From Figure 3’s results, as rated voltage rises from 0.5% to 110%, combined standard uncertainties of amplitude difference and phase deviation show steady growth. Specifically, amplitude difference uncertainty increases from 0.008% to 0.085% (≈10-fold), and phase deviation uncertainty rises from 0.05° to 0.35° (≈7-fold). This trend implies higher voltage increases the transformer’s susceptibility to external interference, expanding measurement uncertainty. Yet, no extreme data changes occur, indicating the evaluation process is stable and reliable.
5.Conclusion
In the research on the uncertainty evaluation method for the verification and measurement results of grid electronic voltage transformers, multiple factors affecting measurement accuracy are analyzed, and scientific and effective evaluation methods are explored. Through theoretical analysis and experimental verification, it not only improves the reliability of the measurement results of voltage transformers but also provides a solid guarantee for the stable operation of the power system.