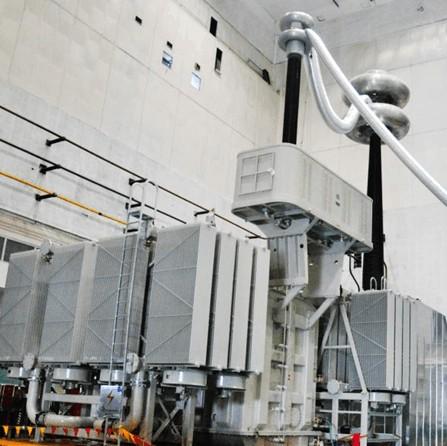
1.Gas Generation and Analysis Principle of High - Voltage Reactors
High - voltage reactors use oil and insulating paper for insulation. Normal operation may see local overheating or discharges (e.g., iron core/winding issues, inter - turn short circuits), causing insulation cracking and producing gases like hydrocarbons (methane, etc.), CO, CO2, H2). These gases reflect internal insulation status, enabling real - time monitoring.
For closed oil - filled reactors, insulation aging and oil oxidation continuously generate (CO)/(CO2). Their concentrations rise over time due to accumulation, so pure (CO)/(CO2) increase can’t judge faults. But gas production rate (average daily gas output) helps distinguish normal aging from faults:

Here: γa = absolute gas production rate (mL/d); (Ci,2)/(Ci,1) = gas concentrations of second/first sampling (μL/L); Δt = actual operation interval (d); m = total oil volume (t); ρ = oil density (t/m3).
1.2 Gas Concentration Analysis Method for High - Voltage Reactors
Regular oil chromatography tests track oil - gas concentrations long - term, showing insulation aging/deterioration. Use three - phase reactor data for scientific analysis. Continuous monitoring and gas production rate calculation help accurately identify insulation status and pre - warn faults.
2. Actual Case
During regular inspection of a power station’s high - voltage reactor (model: BKD - 16700/550 - 66), CO three - phase concentrations were 1089.08 μL/L (A), 1152.71 μL/L (B), 1338.24 μL/L (C); CO₂ three - phase data: 4955.73 μL/L (A), 5431.25 μL/L (B), 6736.33 μL/L (C). Some values exceeded alarm thresholds (CO: 850 μL/L; CO₂: 5000 μL/L).Normal paper insulation aging and fault - induced cracking both produce CO/CO₂. Solid insulation aging reflects in oil - dissolved CO/CO₂, with unclear boundaries/patterns.To determine if these alarm - level concentrations are normal, historical dissolved gas test reports were analyzed to identify gas production trends and assess the reactor’s current state.
2.1 CO & CO₂ Production Rate Analysis in Reactor Oil
CO annual absolute production rates are in Table 1, with trends in Figure 1. CO₂ annual rates are in Table 2, trends in Figure 2.


2.2 Analysis of Gas Increment Ratio in the Oil of a High - Voltage Reactor at a Certain Power Station
With reference to the judgment on CO and CO2 in section 10.3 of the DL/T722 standard, when suspecting the aging of the solid insulation material of the equipment, generally ; when suspecting that the fault involves the solid insulation material, CO2/CO < 3.
Calculations were made on the data over the years, and none were less than 3 or greater than 7. There was no sudden change in the growth trend, indicating that there was no fault or aging involving solid materials. The curve of the ratio of offline data of CO2/CO gas over previous times is shown in Figure 3.

In accordance with the Guidelines for Analysis and Judgment of Dissolved Gases in Transformer Oil (DL/T722), the calculated incremental ratios of CO₂ and CO over the years and the gas production rates are both maintained within the standard ranges. There is no occurrence of solid insulation faults or aging phenomena (the standard for the absolute gas production rate of CO₂ is 200 mL/d, and that for CO is 100 mL/d).
2.3 Data Analysis
All data meet DL/T 596 - 2021 requirements.
Over 5 years (no oil filtration), CO/CO₂ concentrations rose faster due to their closed - environment accumulation and high operating temps (max 66°C), accelerating oil/insulation oxidation/cracking. No internal faults or insulation aging exist.
3. Recommendations
Analyzing characteristic gases identifies faults/deterioration for targeted maintenance, ensuring grid stability. For long - term reactor O&M:
Check seals (reactor body, oil conservator) for slow gas - content growth; replace if needed.
Enhance oil - sample chromatography: measure furfural/nitrogen - oxygen content (pre - filtration) to assess oil/paper oxidation.
Perform oil filtration; track post - filtration samples.
Monitor operations for overloads, short - term current surges, and abnormal oil - temp spikes.