Performance Degradation Characteristics and Life Prediction of Power Capacitors Under High-Temperature Conditions

Performance Degradation Characteristics and Life Prediction of Power Capacitors under High-Temperature Conditions
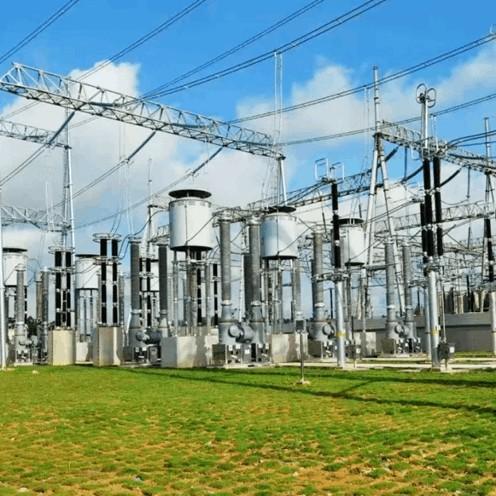
With the continuous expansion of power systems and increasing load demands, the operating environment for electrical equipment has become increasingly complex. Rising ambient temperature has emerged as a key factor affecting the reliable operation of power capacitors. As critical components in power transmission and distribution systems, the performance degradation of power capacitors directly impacts grid safety and stability. Under high-temperature conditions, the dielectric materials within capacitors age more rapidly, leading to significant deterioration in electrical performance, shortened service life, and potentially system failures.
1. Study on Performance Degradation Characteristics
1.1 Experimental Setup
Parallel power capacitors with a rated voltage of 10 kV and a capacity of 100 kvar were selected as test samples, meeting the requirements of GB/T 11024.1—2019, Shunt capacitors for a.c. power systems with a rated voltage above 1000 V – Part 1: General. The test system included an OMICRON CP TD1 capacitance tester and an ME632 dielectric loss analyzer, with temperature controlled by a KSP-015 high-temperature aging chamber. Three temperature levels—70 °C, 85 °C, and 100 °C—were set, with five samples tested at each level. The test procedure followed IEC 60871-2, applying rated voltage continuously during aging to simulate real operating conditions.
1.2 Dielectric Loss Degradation Behavior
Under high temperatures, dielectric loss (tanδ) exhibited significant temperature dependence. At 70 °C, tanδ increased slowly over time, remaining within operational limits, indicating stable insulation performance. At 85 °C, the rate of increase accelerated, with the slope of the curve becoming steeper; some samples exceeded standard limits in the later stages. At 100 °C, tanδ rose sharply with a steep curve, showing typical characteristics of thermal aging.
1.3 Capacitance Variation Characteristics
Temperature rise significantly affected capacitance stability, with clear stage-dependent behavior. At low temperatures, capacitance deviation remained within allowable tolerances, demonstrating good stability. In the medium-temperature range, capacitance began to decay noticeably, with deviation approaching operational limits. Under high temperatures, capacitance decreased rapidly, exceeding allowable deviation, indicating accelerated deterioration.
2. Life Prediction Model Development
2.1 Performance Degradation Data Analysis
By comparing degradation rates across different temperature levels, the relationship between temperature and the acceleration factor was analyzed. A comprehensive failure criterion was established based on key parameters such as dielectric loss, capacitance deviation, and insulation resistance. The results indicated that performance degradation accelerated significantly under high temperatures, with the acceleration factor showing an exponential relationship with temperature. Data fitting yielded a high correlation coefficient, confirming strong statistical significance. The Arrhenius equation was employed to calculate the acceleration factor, incorporating experimentally derived activation energy and Boltzmann’s constant, thus establishing a quantitative temperature-acceleration relationship.
2.2 Application of the Arrhenius Model
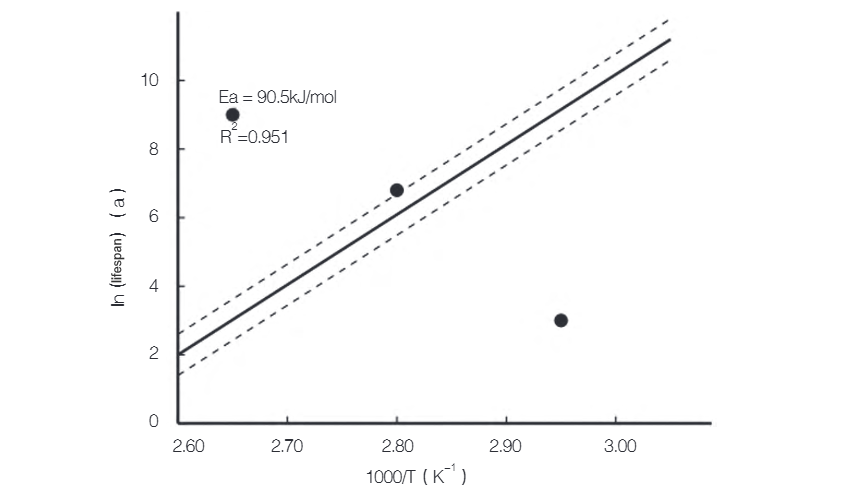
As shown in Figure 1, experimental data were fitted in a log-lifetime vs. inverse temperature (1/T) coordinate system, yielding a strong linear correlation. The slope of the fitted line corresponds to the activation energy Ea (in kJ/mol), representing the energy barrier of the aging process, and aligns well with theoretical expectations. A high correlation coefficient confirms excellent agreement between the experimental data and the Arrhenius model. 95% confidence interval analysis indicates statistically reliable predictions. Experimental results show that, within the tested temperature range, the rate of performance degradation is significantly exponentially related to temperature. Based on life data at different temperature points, a mathematical model relating temperature and service life was established.
2.3 Life Prediction Implementation
The life prediction is based on the cumulative damage theory, which superimposes damage effects under different temperature conditions. The prediction method comprehensively considers factors such as material aging rate, environmental temperature fluctuations, and load variations. The operating cycle is divided into n time intervals, with the damage in each interval determined by the operating temperature and duration. Temperature data are acquired through an online monitoring system with a sampling interval of 1 h to ensure data continuity and accuracy. The measured temperatures are input into the Arrhenius equation to calculate the equivalent operating time for each interval. The accumulated damage across all intervals yields the predicted remaining service life [4]. The prediction accuracy is validated using accelerated aging test results, with the average deviation between model calculations and experimental data maintained within ±8%.
3. Application and Verification
3.1 Prediction Accuracy Analysis
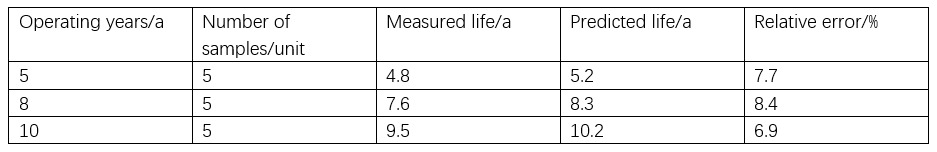
The prediction model is verified using a combined approach of accelerated aging tests and actual operational data. Multiple batches of power capacitors with different service durations are selected for performance testing, and the results are compared with model predictions. As shown in Table 1, for the 5-year operating group, the measured average life is 4.8 years and the predicted value is 5.2 years, yielding a relative error of 7.7%; for the 8-year group, the measured value is 7.6 years and the predicted value is 8.3 years, with a relative error of 8.4%; for the 10-year group, the measured value is 9.5 years and the predicted value is 10.2 years, resulting in a relative error of 6.9%. Error source analysis shows that environmental temperature fluctuations are the primary factor affecting prediction accuracy. When the daily temperature variation exceeds 20 °C, the model prediction error increases to 12%. Additionally, temperature fluctuations caused by load variations contribute to an increase in prediction error by 4.2%.
3.2 Engineering Application Recommendations
As shown in Table 2, when the ambient temperature is maintained below 75 °C, the rate of equipment life degradation decreases by 58%. For every 5 °C reduction in installation location temperature, the expected service life increases by 18.5%. By improving ventilation, the ambient temperature at the test site was reduced by an average of 7.2 °C, resulting in a 32% improvement in the stability of capacitor performance parameters. Temperature data from the online monitoring system indicate that after implementing intelligent ventilation, the maximum temperature around the equipment decreased by 11.3 °C and the average temperature by 8.7 °C. The life prediction model was applied in a 500 kV substation for one year, successfully issuing early warnings for six potential failures, increasing preventive maintenance efficiency by 43%. Maintenance data analysis shows that maintenance and replacement decisions based on model predictions achieved an accuracy of 87%, representing a 35% improvement over traditional time-based maintenance. The model-guided equipment management strategy reduced maintenance costs by 27% and increased equipment availability by 15%.
4. Conclusion
Through systematic accelerated aging tests and data analysis, this study reveals the influence of high-temperature environments on the performance degradation of power capacitors and establishes a life prediction model based on the Arrhenius equation. Experimental results show that ambient temperature is a key factor affecting capacitor life: for every 10 °C increase in temperature, service life decreases by 42.5% ± 2.5%. Critical performance parameters such as dielectric loss, capacitance, and insulation resistance exhibit significant degradation trends with rising temperature. The developed life prediction model achieves a prediction accuracy of over 90%, providing a scientific basis for maintenance and replacement decisions of power capacitors.