1. Pag-analisa sa mga Katangian sa Generasyon sa Kuryente gikan sa Hangin ug Solar Photovoltaic
Ang pag-analisa sa mga katangian sa generasyon sa kuryente gikan sa hangin ug solar photovoltaic (PV) mahimong pundok sa pagdisenyo og komplementaryong sistema. Ang estadistikal nga analisis sa taas nga datos sa hangin ug solar irradiance para sa isyuha nga rehiyon nagpakita nga ang mga resources sa hangin adunay seasonal nga pagkakaiba, uban sa mas taas nga bilis sa hangin sa yelo ug tagsibol ug mas baba sa tag-init ug autumn. Ang generasyon sa kuryente gikan sa hangin proporsyonal sa cube sa bilis sa hangin, resulta sa significant nga pagkakaiba sa output.
Ang mga resources sa solar, bahin naman, nagpakita og clear nga diurnal ug seasonal patterns—mas mataglam nga oras sa araw ug mas taas nga radiation sa tag-init, ug mas baba nga kondisyon sa yelo. Ang efektiividad sa PV negatibong naapektuhan sa pagtaas sa temperatura. Sa paghambing sa temporal nga distribusyon sa enerhiya gikan sa hangin ug solar, ma-evident nga sila nagpakita og komplementaryong pagkatawo sa daily ug annual cycles. Kini nga komplementarity mao ang nag-enable sa disenyo og efficient ug stable nga power systems, diin ang optimal nga capacity ratio sa duha ka sources sa enerhiya mahimo molihok sa pag-smooth sa overall nga output sa kuryente.
2. Paghimo og Modelo sa Wind-Solar Hybrid Power Generation Systems
2.1 Modelo sa Subsystem sa Wind Power
Ang modelo sa subsystem sa wind power gitukod batas sa datos sa bilis sa hangin ug turbine characteristics. Ang Weibull distribution gigamit sa pag-fit sa probability distribution sa bilis sa hangin, accurately describing its statistical behavior. Ang relasyon tali sa output power sa turbine ug bilis sa hangin representado pinaagi sa piecewise function nga nag-include og key parameters sama sa cut-in wind speed, rated wind speed, ug cut-out wind speed.
Ang least squares method gipakita sa pag-fit sa turbine power curve, yielding a mathematical expression of power output versus wind speed. Aron makontrol sa randomness sa bilis sa hangin, ang Monte Carlo simulation method gipakilala aron iprognose ang generation sa wind farm. Ang modelo accurately reflects the dynamic characteristics of wind power systems and provides a foundation for system optimization. It also incorporates the impact of wind direction changes on generation efficiency by introducing a wind direction correction factor, thereby improving prediction accuracy.

2.2 Modelo sa Subsystem sa Photovoltaic Power
Ang modelo sa PV subsystem comprehensive considers solar irradiance, ambient temperature, ug PV module characteristics. A statistical model of solar irradiance is established to describe its temporal variations. The output characteristics of PV modules are represented by I-V curves. Temperature effects on efficiency are modeled using a single-diode equivalent circuit, with output power calculated by solving a system of nonlinear equations.
The model also includes factors such as shading and dust accumulation, introducing correction coefficients to enhance prediction accuracy. It accounts for PV module aging by incorporating an annual degradation rate to forecast long-term power output changes. This model accurately reflects PV system performance under varying environmental conditions.
2.3 Energy Storage System Model
Ang energy storage system model primarily based on lithium-ion battery characteristics. A dynamic model of battery state of charge (SOC) is developed to describe charging and discharging processes. Self-discharge characteristics and charge/discharge efficiency are considered, with a temperature correction factor introduced to reflect environmental impacts. Battery lifespan is modeled using a combination of cycle count and depth of discharge (DOD) to predict capacity degradation.
The model accurately reflects battery performance under different operating conditions, supporting optimal sizing and dispatch strategies. It also considers internal resistance variation by establishing functional relationships between resistance, cycle count, and temperature, enabling more precise simulation of dynamic behavior. Key outputs include real-time SOC, available capacity, charge/discharge power, and expected lifespan—providing comprehensive data support for optimal operation and maintenance.
2.4 System Integration Model
The integrated system model combines wind, solar, and storage subsystems into a unified framework. The equivalent load method is used to handle load fluctuations, and a system power balance equation is established. Reliability indices such as Loss of Load Probability (LOLP) and Expected Energy Not Supplied (EENS) are introduced to evaluate system performance. Sequential time-series simulation is used to compute system operating states across different time scales.
The model accounts for interactions between subsystems, such as wind turbine shadowing on PV panels. It also incorporates a grid interface, enabling analysis of grid-connected operation strategies, including economic dispatch under time-of-use tariffs and grid frequency regulation services. Outputs include total power generation, load satisfaction rate, and economic performance metrics, providing a comprehensive theoretical basis for system planning, design, and operational decision-making.
3. Optimization Methods and Experimental Analysis of Wind-Solar Hybrid Systems
3.1 Objective Function and Constraints
The optimization objective function integrates economic, reliability, and environmental considerations. The economic objective minimizes total system cost, including initial investment, operation and maintenance (O&M), and replacement costs. The reliability objective maximizes power supply reliability, quantified by minimizing LOLP. The environmental objective is measured by maximizing carbon emission reductions.
Constraints include power balance, energy storage capacity limits, and equipment operational limits. The power balance constraint ensures that load demand is met at all times. Storage capacity constraints limit depth of discharge (DOD) to extend battery life. Equipment constraints consider rated power and operational characteristics of components. A multi-objective weighting method integrates these goals into a single objective function, with weights determined based on decision-maker preferences and application scenarios.
3.2 Application of Particle Swarm Optimization (PSO)
Particle Swarm Optimization (PSO), an intelligent optimization algorithm, is applied to the design of wind-solar hybrid systems. Simulating bird flocking behavior, PSO searches for optimal solutions in the solution space. Each particle represents a potential system configuration, including decision variables such as wind turbine capacity, PV capacity, and storage capacity. Particle position and velocity are updated iteratively, converging toward the global optimum.
To enhance performance, a linearly decreasing inertia weight strategy is adopted—maintaining strong global exploration early and enhancing local exploitation later. Adaptive mutation is introduced to avoid local optima. Given problem complexity, a hierarchical encoding strategy separates continuous and discrete variables. The algorithm terminates upon reaching the maximum iteration count or when the optimal value changes by less than a threshold over consecutive iterations.
3.3 Experimental Design and Parameter Settings
The experiment is based on actual meteorological and load data from a specific region, using a typical year of hourly data. Meteorological inputs include hourly wind speed, solar irradiance, and ambient temperature. Load profiles follow a typical industrial park consumption pattern, reflecting seasonal and diurnal variations. Equipment parameters are selected from mainstream commercial wind turbines and PV modules, with performance data sourced from manufacturer test reports.
A lithium-ion battery is used for storage, with parameters including rated capacity, charge/discharge efficiency, and cycle life. PSO parameters are set as follows: population size = 50, maximum iterations = 1000, inertia weight linearly decreasing from 0.9 to 0.4, and learning factors c1 and c2 both set to 2. To ensure result reliability, each configuration is run 30 times, with the average taken as the final result.
3.4 System Performance Evaluation Metrics
Performance evaluation metrics cover technical, economic, and environmental aspects. Technical indicators include system reliability, energy utilization rate, and power smoothing. Reliability is measured by the Reliability of Supply Capability Index (RSCI) and Loss of Power Supply Probability (LPSP). Energy utilization reflects renewable energy efficiency, while power smoothing evaluates output stability. Economic indicators include Levelized Cost of Electricity (LCOE), Net Present Value (NPV), and payback period. LCOE considers lifecycle costs, NPV reflects project profitability, and payback period assesses capital recovery speed.
The environmental indicator is carbon emission reduction, calculated by comparison with conventional fossil-fuel-based generation. Additionally, a composite performance index—System Comprehensive Benefit Index (SCBI)—integrates technical, economic, and environmental factors through weighted summation. These metrics and their weights are determined based on expert judgment and practical needs, providing a comprehensive assessment of system performance and supporting informed decision-making.
| Category | Indicator Name | Symbol | Unit | Value |
| Technical Indicators | Power Supply Reliability | RSCI | % | 99.2 |
| Loss of Power Supply Probability | LPSP | % | 0.8 | |
| Energy Utilization Rate | EUF | % | 87.5 | |
| Power Supply Cost | POE | yuan/kWh | 0.85 | |
| Economic Indicators | Levelized Cost of Electricity | LCOE | yuan/kWh | 0.45 |
| Net Present Value | NPV | ten thousand yuan | 1200 | |
| Payback Period | PBP | year | 7.5 | |
| Environmental Indicators | Carbon Emission Reduction | CER | t/year | 3500 |
| Comprehensive Indicators | Comprehensive Benefit Index of System | SCBI | — | 0.92 |
The optimization results demonstrate that the wind-solar hybrid power generation system offers significant advantages over single-energy systems. Under the baseline scenario, the optimal configuration consists of 2 MW of wind power capacity, 1.5 MW of photovoltaic (PV) capacity, and 500 kWh of energy storage. This configuration reduces the Loss of Power Supply Probability (LPSP) to below 1% and lowers the Levelized Cost of Electricity (LCOE) by approximately 15% compared to standalone wind or PV systems. Sensitivity analysis reveals that equipment cost has the greatest impact on optimization outcomes— a 10% reduction in cost leads to an approximate 8% decrease in LCOE.
Load profile variations significantly affect energy storage sizing; increased peak-to-valley load differences require larger storage capacity. Optimal configurations vary across regions: wind-rich areas favor higher wind power ratios, while sun-abundant regions increase the share of PV. Multi-objective optimization generates a Pareto front, enabling decision-makers to balance economic efficiency and reliability according to practical needs. Results also show that incorporating a carbon trading mechanism further improves economic performance, reducing LCOE by an additional 5%–10%. Long-term simulation confirms system stability, with performance degradation over a 20-year operational period remaining within the designed tolerance.
| Configuration Scheme | Wind Power Capacity (MW) | Photovoltaic Capacity (MW) | Energy Storage Capacity (kWh) | LPSP (%) | LCOE (yuan/kWh) | Carbon Emission Reduction (t/year) | SCBI |
| Optimization Scheme | 2.0 | 1.5 | 500 | 0.8 | 0.45 | 3500 | 0.92 |
| Pure Wind Power | 3.5 | 0 | 300 |
2.5 |
0.53 |
2800 |
0.78 |
| Pure Photovoltaic |
Maghatag og tip ug pagsalig sa author
Mahitungod sa mga eksperto
China
Gipareserbado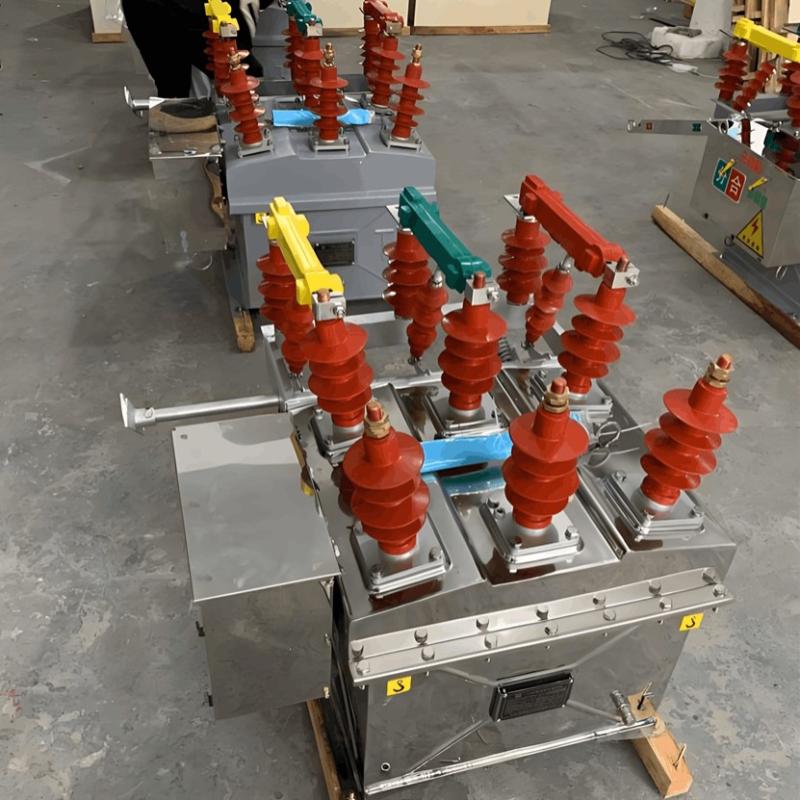
Minimum nga Operasyonal nga Voltaje para sa Vacuum Circuit Breakers
Minimum Operating Voltage for Trip and Close Operations in Vacuum Circuit Breakers1. IntroductionKung makita nimo ang termino "vacuum circuit breaker," mahimong dili familiar kini. Apan kon mogwarta ta og "circuit breaker" o "power switch," daghan sa mga tawo ang mosabot kini. Sa katunayan, ang vacuum circuit breakers mao ang importante nga komponente sa modernong sistema sa kuryente, responsable sa pagprotekta sa mga kuryente gikan sa pinsala. Karon, atong i-explore ang importante nga konsepto
10/18/2025
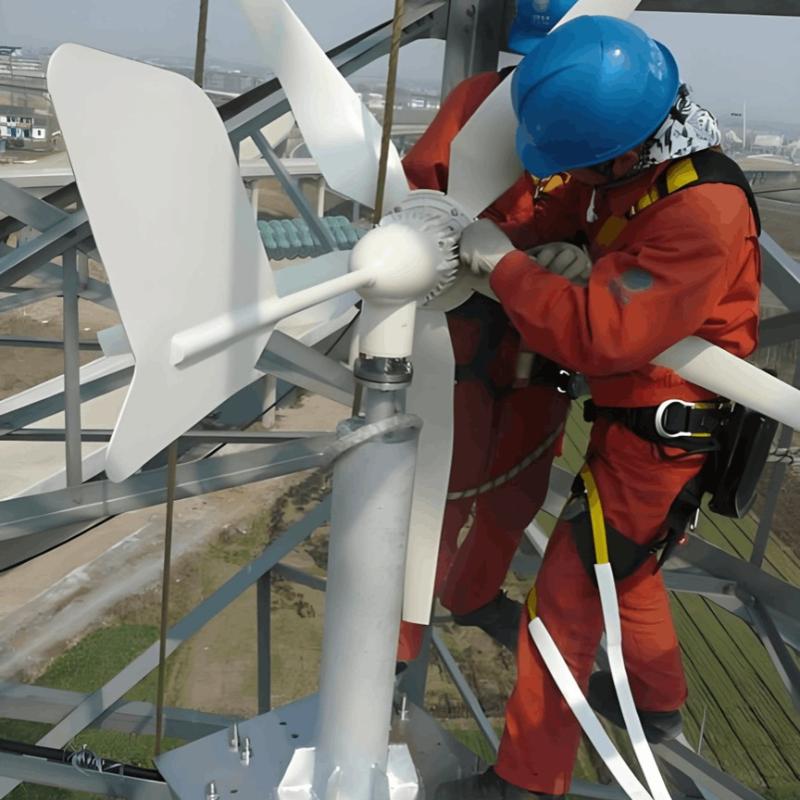
Pasigurahon ang Reliability sa Hybrid System pinaagi sa Full Production Testing
Ang mga Prosedurang Pagsusulit ug mga Metodo alang sa mga Sistema sa Hugnawan-SolarArigos nga matubag ang kahigayonan ug kalidad sa mga sistema sa hugnawan-solar, kinahanglan nga gisagol ang daghang mahimong mga pagsusulit sa panahon sa produksyon. Ang pagsusulit sa turbin sa hangin nagsama sa pagsusulit sa katungod sa output, pagsusulit sa elektrikal nga seguridad, ug pagsusulit sa panglawas nga adaptabilidad. Ang pagsusulit sa katungod sa output nangailangan og pagkuha sa voltaje, kuryente, ug
10/15/2025
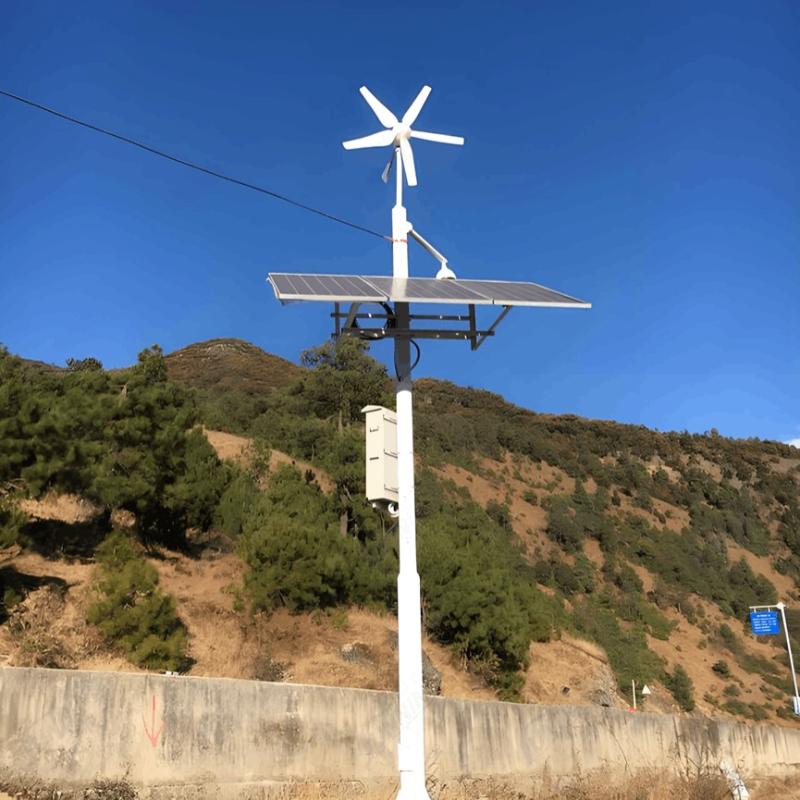
Sistema nga Hybrido sa Hangin-Silangan Faults & Solutions
1. Usahay nga mga Sayop ug mga Dahon sa Wind TurbinesIsip usa ka mahimong bahin sa wind-solar hybrid nga mga sistema, ang mga wind turbines kasagaran magdawat og sayop sa tulo ka aspeto: mechanical structure, electrical systems, ug control functions. Ang pag-ubos ug pagkasira sa mga blades mao ang pinaka-usa ka common nga mechanical failure, kasagaran gihatagan niini tungod sa long-term nga impakto sa hangin, material fatigue, o manufacturing defects. Ang field monitoring data nagpakita nga ang
10/14/2025
Unsaon Ang Mas Maayo nga Paghimo sa Hybrid Wind-Solar Power? Ang mga Praktikal nga Pag-aplikar sa AI sa Optymasyon ug Kontrol sa Sistema
Paghimo og Intelligent nga Kontrol sa Wind-Solar Hybrid Renewable Power Systems Gamit ang Artificial IntelligenceAng mga wind-solar hybrid renewable energy systems nagsilbi isip usa ka paagi sa pag-angat sa sustinabilidad ug komplementaridad sa mga resources sa hangin ug adlaw. Apan, ang intermittent ug fluctuating nga kalihukan sa kini nga mga source sa energia nagresulta sa unstable nga output sa power, negatibong naapektuhan ang reliability sa supply ug kalidad sa power. Ang pag-optimize sa s
10/14/2025
Inquiry
Pangutana
Pangutana sa IEE-Business Application
Pangita og mga equipment gamit ang IEE-Business app asa asa ug kailan man sugad og pagkuha og solusyon pagsulay sa mga eksperto ug pagpadayon sa industriya nga pakisayran suportahan ang imong proyekto sa kuryente ug negosyo


|