1. Introduction
Grid electronic voltage transformers, as indispensable measuring components in power systems, have their measurement accuracy directly tied to the stable operation and efficient management of power systems. However, in practice, due to the inherent characteristics of electronic components, environmental factors, and limitations of measurement methods, the measurement results of voltage transformers often involve uncertainty. This uncertainty not only impacts the accuracy of power data but also misleads the dispatching, control, and protection strategies of power systems. Thus, in - depth research on the uncertainty evaluation methods for the verification and measurement results of grid electronic voltage transformers is crucial for enhancing the measurement accuracy of power systems.
This study aims to systematically analyze the factors affecting the measurement uncertainty of voltage transformers, including the temperature drift, aging, and noise interference of electronic components, as well as changes in temperature, humidity, and electromagnetic fields in the measurement environment. Through this, scientific and reasonable uncertainty evaluation methods will be explored. By constructing mathematical models combined with statistical principles and metrology knowledge, this research will comprehensively assess the measurement uncertainty of grid electronic voltage transformers under different working conditions, providing a theoretical basis and technical support for formulating more precise verification regulations and improving the product quality of voltage transformers.
2. Experiment for Evaluating Uncertainty of Measurement Results
2.1 Experimental Object
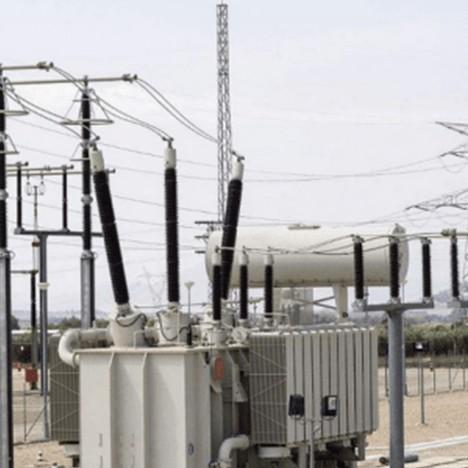
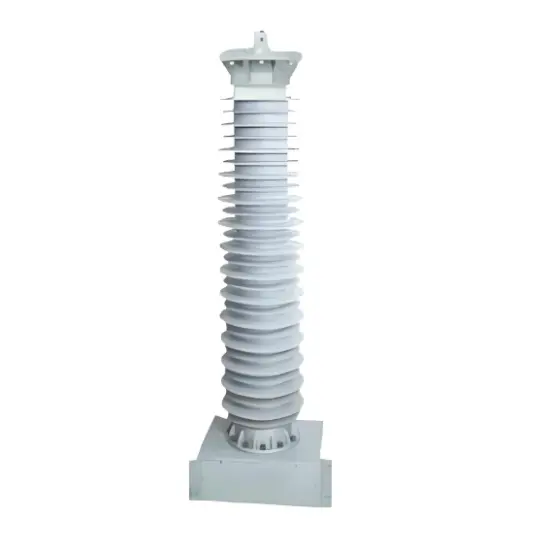
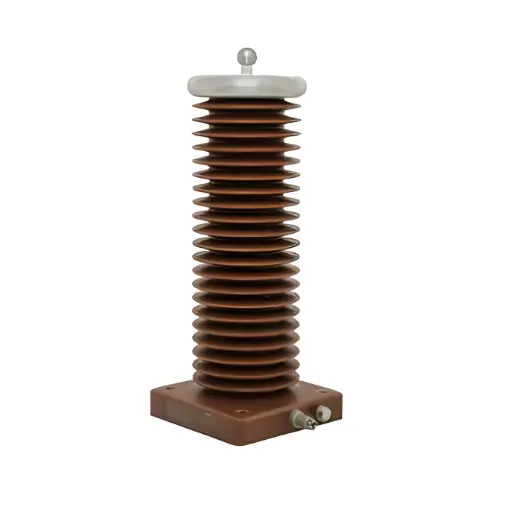
For uncertainty evaluation of grid electronic voltage transformers, a precision voltage calibration device with an accuracy of 0.001 level is selected, covering a measurement range of 1–1000 V. The voltage transformer to be verified is designed for scenarios with a primary voltage of 10 kV–50 kV and a secondary voltage of 100 V, with an accuracy level of 0.02. The structure of the grid electronic voltage transformer is shown in Figure 1.
The experimental environment is set to a constant temperature of 20 ± 2 °C, with the relative humidity maintained below 60%, eliminating potential environmental impacts on measurement results.
2.2 Verification and Measurement Method for Grid Electronic Voltage Transformers
During the verification of grid electronic voltage transformers, a scientific uncertainty evaluation method is required to ensure measurement accuracy. Using the grid electronic voltage transformer shown in Figure 1 as the standard device, a comparison - based circuit connection is adopted. This enables seamless alignment between the tested electronic voltage transformer and the standard device, as illustrated in Figure 2.
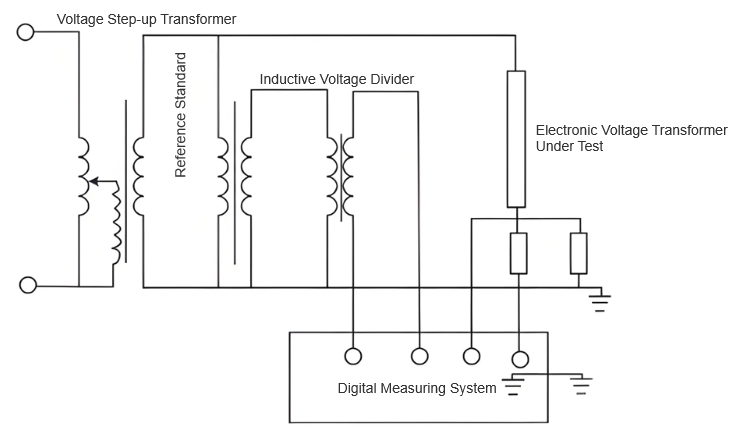
Subsequently, a high - accuracy digital measurement system directly reads and calculates the error of the electronic voltage transformer under test. The standard device model is DHBV - 110/0.02, with excellent accuracy underpinning the verification. For the transformer under test, rated voltage points of 0.5%, 2%, 10%, 50%, and 110% are set to cover its operating range. Noteworthily, though maximum allowable error limits for these points are the same under full - and light - load conditions, electronic components’ temperature drift and aging may cause significant stability differences across conditions. Thus, each point’s stability must be independently evaluated to control verification result uncertainty, meeting power grid operation’s strict requirements for high - accuracy measurement technology.
3. Mathematical Model
In the experiment for evaluating the uncertainty of verification and measurement results of grid electronic voltage transformers, when verifying the accuracy of the device under test, its uncertainty is often quantified through multiple dimensions, such as accuracy deviation and phase lag. These two indicators reflect the amplitude difference and phase deviation between the measured value and the true value, respectively. Thus, independent mathematical models can be constructed to accurately describe these sources of uncertainty. For the accuracy deviation Y, a linear regression model can be used, expressed as:

Where and are model parameters; is the input signal of the grid electronic voltage transformer; is the random error term. For the phase lag , it can be expressed by a trigonometric function model as

Where α represents the fixed phase shift;θ(X) is a phase function that varies with the input signal. For more detailed analysis, nonlinear terms or polynomial approximations can be introduced to enhance the model’s accuracy. The establishment of these mathematical models provides a solid theoretical basis and quantitative tools for comprehensively and systematically evaluating the uncertainty of measurement results.
4.Results of the Uncertainty Component Evaluation Experiment
In the verification of grid electronic voltage transformers, multiple sets of voltage levels are set for uncertainty assessment. The rated voltage points of 0.5%, 2%, 10%, 50%, and 110% are selected and measured using the comparison method. The average values of the amplitude difference and phase deviation are recorded and calculated as the reference values at the corresponding voltage levels, so as to accurately evaluate the performance uncertainty of the tested transformer.
4.1 Type A Uncertainty Evaluation
Type A uncertainty reflects the degree of dispersion among the results obtained during repeated measurements of the same object. Its calculation formula is:

Where n is the number of measurements; xi is the i-th measured value;xˉ is the arithmetic mean of the measured values.

Then, for the rated voltage points of 0.5%, 2%, 10%, 50%, and 110%, the evaluation results of Type A uncertainty are shown in Table 1.
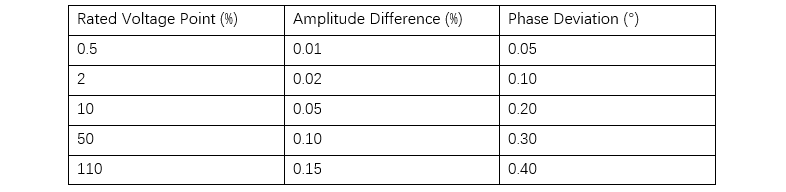
As can be seen from Table 1, as the rated voltage point increases, the Type A uncertainty of both the amplitude difference and the phase deviation shows an increasing trend. This is because at lower voltage levels, the voltage transformer is more stable, resulting in less dispersion in the measurement results. However, at higher voltage levels, the voltage transformer is affected by more factors, thus leading to greater dispersion in the measurement results.
4.2 Evaluation of Type B Uncertainty
Under JJF 1059.1—2022 Evaluation and Expression of Measurement Uncertainty, Type B uncertainty comes from reasonably inferring known relevant information to estimate its standard deviation. This information may involve equipment specifications from manufacturers, data of industry - recognized calibration methods, or statistical analysis of historical measurement data. The core of Type B uncertainty is to define the possible variation range of the measured value based on experience or professional knowledge, with its half - width being half the range width.
Then, select an appropriate coverage factor k for quantification according to the probability distribution characteristics and required confidence level. Usually, if measured values are uniformly distributed within the preset interval (each value has equal probability), the uniform distribution model is used, and k can be taken as an approximation of √3
to ensure evaluation accuracy and rigor. The calculation formula for Type B uncertainty is

Where a is the half - width of the measurement variation interval.
For the rated voltage points of 0.5%, 2%, 10%, 50%, and 110%, the evaluation results of Type B uncertainty are shown in Table 2.
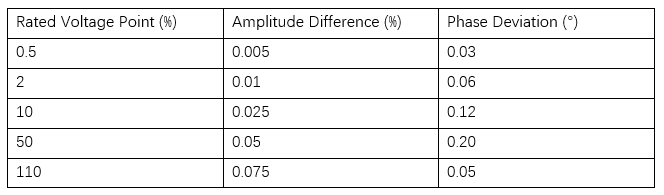
As can be seen from Table 2, at different rated voltage points, whether for amplitude difference or phase deviation, the uncertainty shows an increasing trend as the voltage level rises. Compared with Type A uncertainty, the evaluation of Type B uncertainty relies more on the accuracy and completeness of known information, reflecting a prior estimate of the performance of the voltage transformer under measurement. Therefore, in practical applications, comprehensively considering Type A and Type B uncertainties allows for a more comprehensive grasp of the accuracy and reliability of measurement results.
4.3 Evaluation of Combined Standard Uncertainty
When evaluating the combined standard uncertainty, if the verification and measurement results of each grid electronic voltage transformer are independent and uncorrelated (i.e., their correlation coefficients are all 0), the uncertainties follow the principle of linear combination for accumulation. Based on this, the evaluation of the combined standard uncertainty can be expressed by the following formula

Then, for the rated voltage points of 0.5%, 2%, 10%, 50%, and 110%, the evaluation results of the combined standard uncertainty are shown in Figure 3.
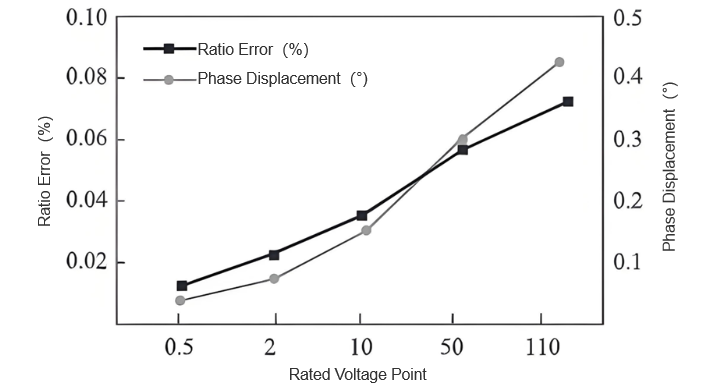
From Figure 3’s results, as rated voltage rises from 0.5% to 110%, combined standard uncertainties of amplitude difference and phase deviation show steady growth. Specifically, amplitude difference uncertainty increases from 0.008% to 0.085% (≈10 - fold), and phase deviation uncertainty rises from 0.05° to 0.35° (≈7 - fold). This trend implies higher voltage increases the transformer’s susceptibility to external interference, expanding measurement uncertainty. Yet, no extreme data changes occur, indicating the evaluation process is stable and reliable.
5.Conclusion
In the research on the uncertainty evaluation method for the verification and measurement results of grid electronic voltage transformers, multiple factors affecting measurement accuracy are analyzed, and scientific and effective evaluation methods are explored. Through theoretical analysis and experimental verification, it not only improves the reliability of the measurement results of voltage transformers but also provides a solid guarantee for the stable operation of the power system.