What is a Load Curve?
Load Curve
A load curve is defined as a graph that shows how energy demand varies over time from a power source.
If the curve covers 24 hours, it is called a daily load curve. For a week, month, or year, it is called the weekly, monthly, or yearly load curve.
The load duration curve reflects the activity of a population quite accurately with respect to electrical power consumption over a given period of time. To understand the concept better its important that we take the real life example of load distribution for an industrial load and a residential load, and have a case study on them, to be able to appreciate its utility from the perspective of an electrical engineer.
Load Duration Curve
This curve shows the duration of specific load demands over a period.
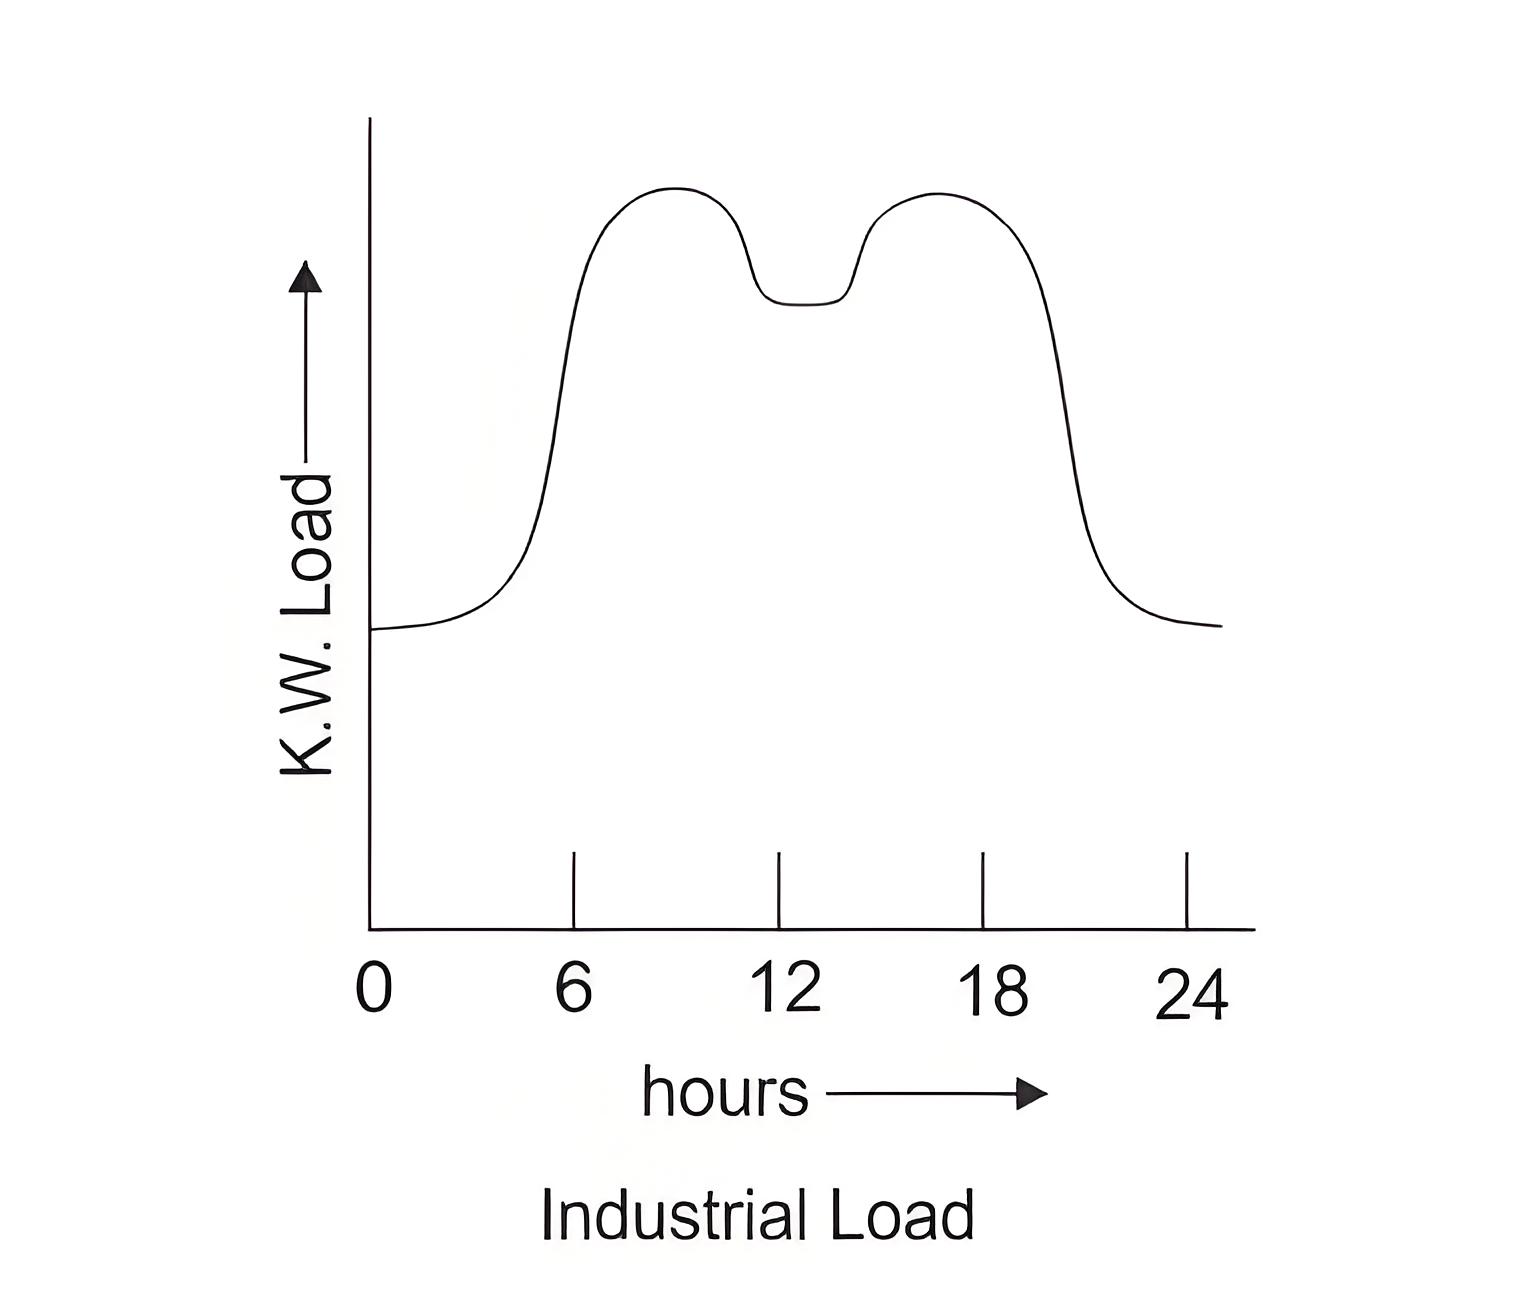
Case Study on Daily Industrial Load Curve
The load duration curve for an industrial load over 24 hours shows that demand rises after 5 AM as machinery starts warming up. By 8 AM, the entire load is active and remains steady until just before noon when it drops slightly for lunch. The demand returns to its morning level around 2 PM and stays steady until 6 PM. In the evening, machinery shuts down, and demand falls to a minimum by 9 or 10 PM, staying low until 5 AM the next day. This pattern repeats every 24 hours.
Case study on Daily Residential Load Curve
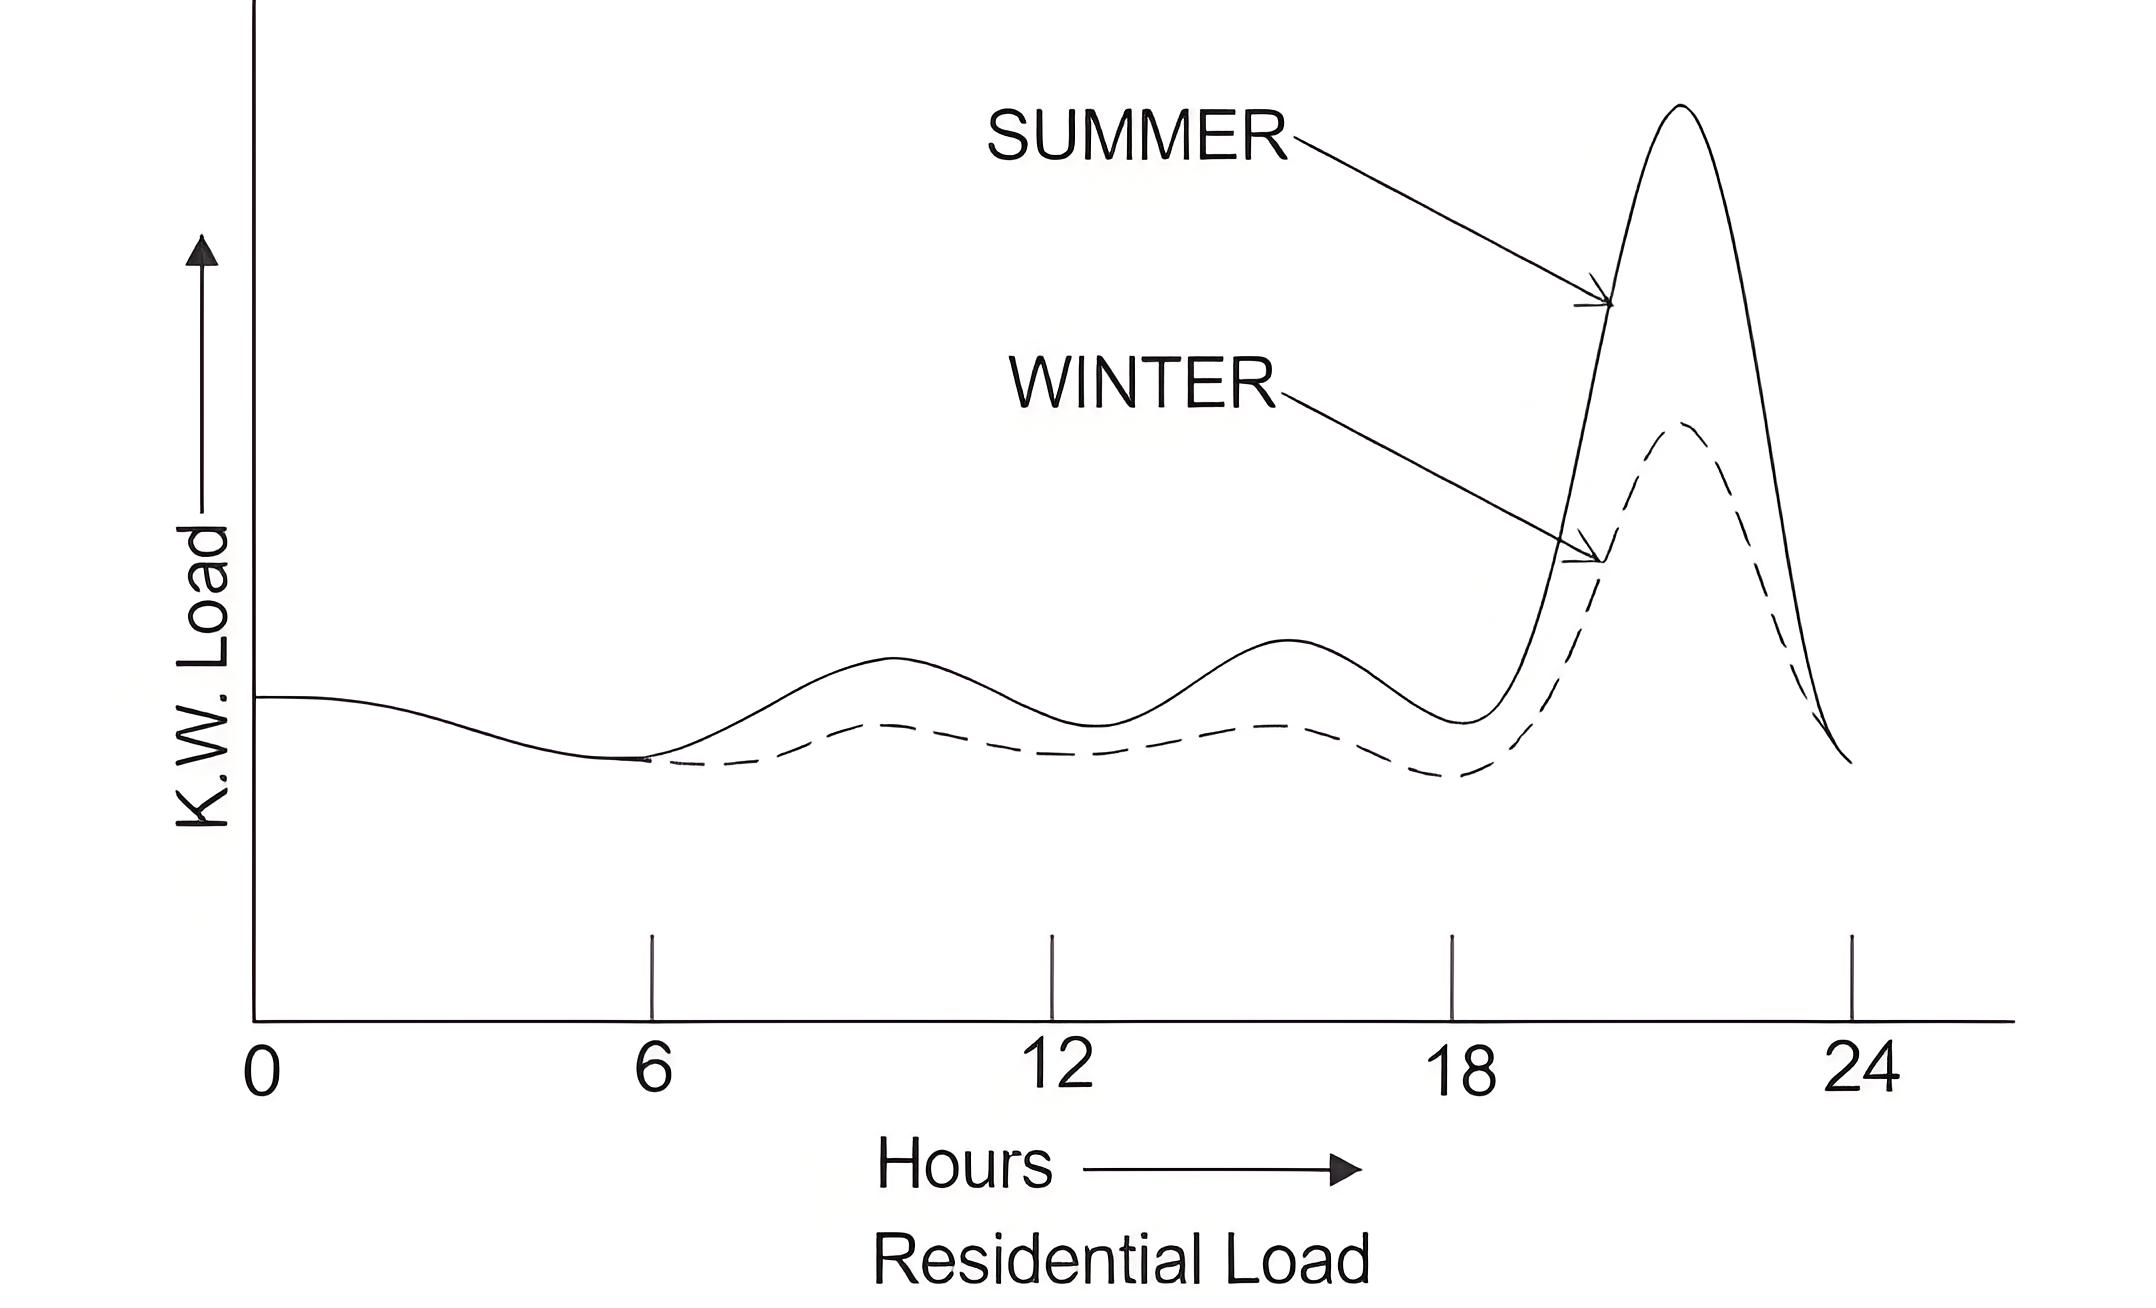
In case of a residential load, as we can see from the diagram below, the minimum load is reached at about 2 to 3 hours at morning, when most people are asleep and during 12 noon, when most people are out at work. Whereas, the peak of the residential load demand starts at around 17 hrs and lasts upto 21 to 22 hrs at night, after which again the load drops rapidly, as most people retire to bed.
Power Plant Operations
Load curves help determine the capacity and operational schedule of power plants, ensuring efficient energy production.

 Login
Login