Design of a Remote Monitoring and Fault Early-Warning System for High-Voltage Disconnectors
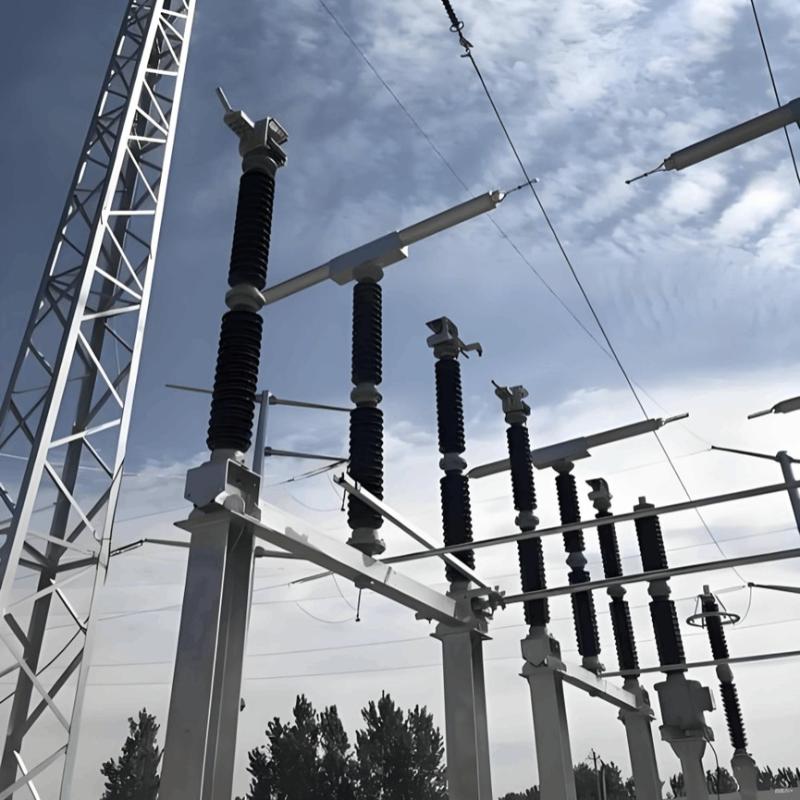
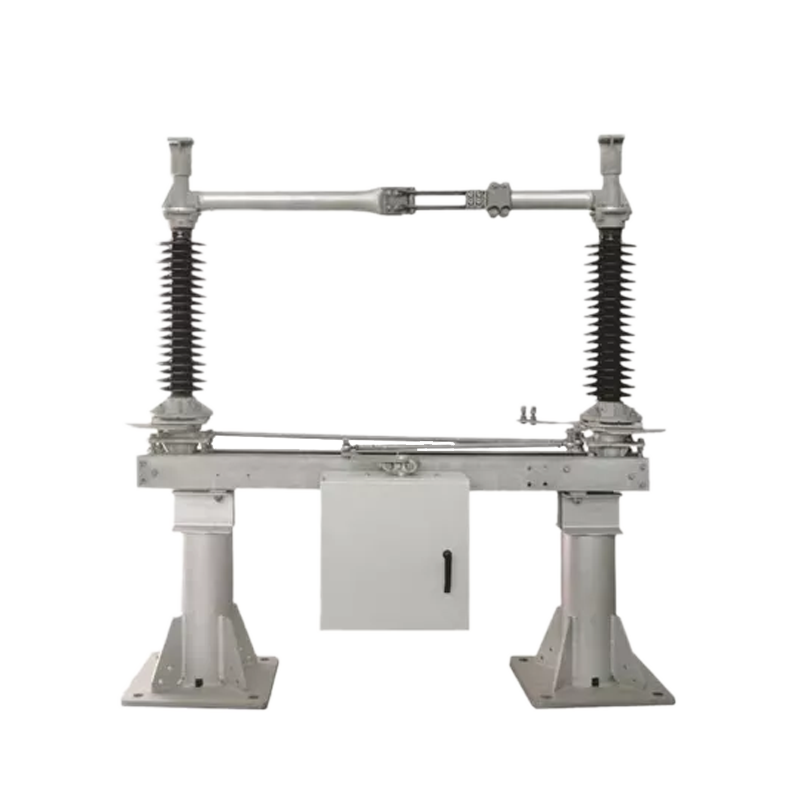
The operational status of high-voltage disconnectors directly impacts the safety and stability of power grids. Currently, the operation and maintenance (O&M) of high-voltage disconnectors face numerous challenges—traditional O&M methods are inefficient, slow to respond, and struggle to accurately predict faults. Against this backdrop, developing a remote monitoring and fault early-warning system for high-voltage disconnectors is of great significance.
1. Overall Design of the Remote Monitoring and Fault Early-Warning System
1.1 Fundamental Concept
The remote monitoring and fault early-warning system for high-voltage disconnectors is an intelligent solution that integrates multiple technologies to enable real-time monitoring, remote control, and proactive fault risk prediction. It employs sensor technologies (e.g., infrared thermometry, vibration monitoring) to collect operational data, communication technologies to ensure reliable data transmission, and data analytics (including data mining and machine learning) to forecast fault trends.
1.2 System Architecture
Data Acquisition Layer: Deploys diverse sensors to collect multi-dimensional operational data—including temperature, vibration, current, and voltage—from the disconnector.
Data Transmission Layer: Utilizes wireless communication or fiber-optic transmission to ensure stable, high-speed data transfer even in complex electromagnetic environments.
Data Processing Layer: Applies data cleaning, mining, and modeling techniques to deeply analyze data and identify latent fault signatures.
User Management Layer: Provides operators with an intuitive interface for remote control, parameter configuration, data queries, and user permission management.
These layers work in close coordination—spanning data acquisition, transmission, processing, and visualization—to form a complete, efficient system capable of effective disconnector management.
2. Monitoring Technologies and Data Processing Solutions
2.1 Monitoring Technology Design
Infrared thermometry detects surface infrared radiation to monitor temperature; abnormal heating may indicate poor contact or other hidden faults. Electrical parameters (current/voltage) are monitored via instrument transformers to detect anomalies such as short circuits or overloads through waveform analysis.
2.2 Data Processing Scheme
First, raw data undergoes cleaning and preprocessing—using filtering algorithms and threshold-based logic—to remove noise and outliers, ensuring data reliability. Next, data mining algorithms uncover hidden correlations among monitoring variables and extract pre-fault feature patterns to build predictive models. Finally, machine learning algorithms train on extensive historical datasets to establish mappings between monitoring data and fault types, enabling trend prediction. If predictions exceed predefined thresholds and logical rules, the system automatically generates fault early-warning signals.
3. System Implementation
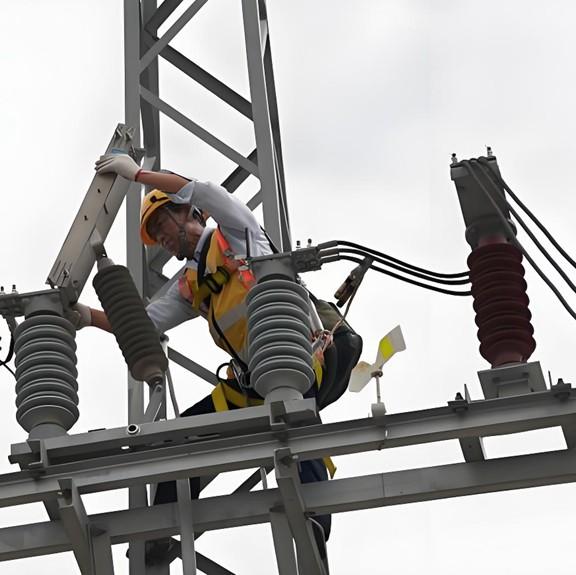
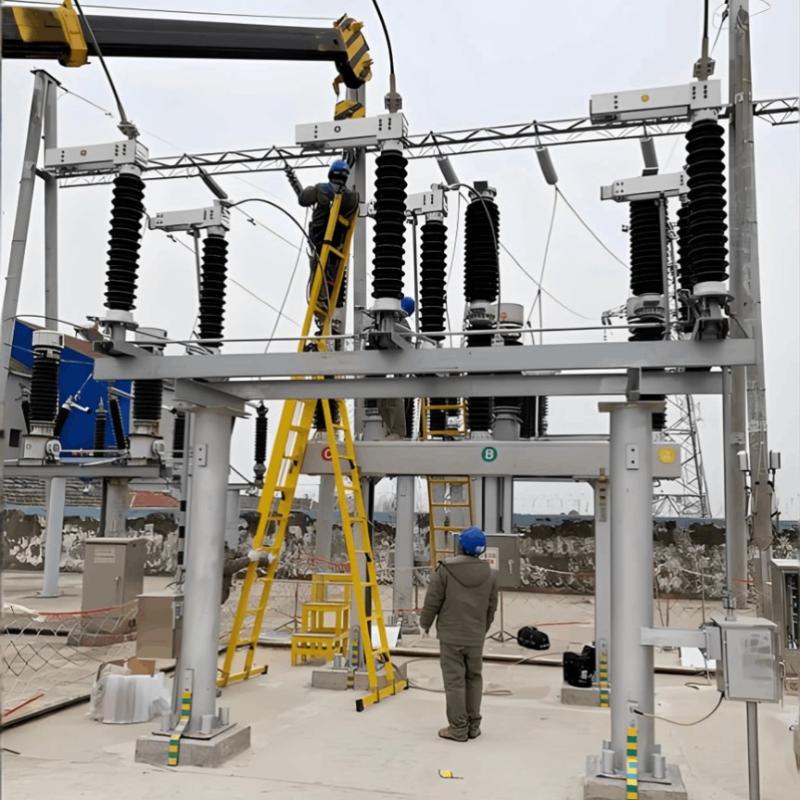
3.1 System Deployment
Sensors: Infrared sensors are installed at key heat-generating locations (e.g., contact points) for accurate temperature measurement; vibration sensors are mounted on critical mechanical nodes (e.g., drive rods, operating mechanism housings).
Data Transmission: For short distances with low interference, wireless modules (configured with appropriate frequency bands and protocols) are used; for long-distance or high-reliability needs, fiber-optic systems are deployed following installation standards to minimize signal loss.
Software: Before installing monitoring and warning software, its runtime environment is configured. Post-installation, parameters such as data sampling frequency and warning thresholds are set to ensure hardware-software compatibility and stable operation.
3.2 System Testing
Functional tests use signal simulators to emulate various disconnector states, verifying data accuracy across temperature, vibration, and electrical parameters. Real-time monitoring is validated during actual switching operations by checking if position status and operational parameters update instantly on the interface. Fault warning functionality is tested by artificially inducing common failure scenarios to confirm timely alerts. Iterative testing, issue resolution, and optimization ensure the system meets practical power grid requirements.
4. System Performance Evaluation
4.1 Evaluation Metrics
Key performance indicators include:
Fault Warning Accuracy Rate: Calculated as (Number of Correct Warnings / Total Actual Faults) × 100%. Higher accuracy indicates better fault identification capability.
False Alarm Rate: (Number of False Alarms / Total Warnings) × 100%. A low rate avoids unnecessary maintenance and enhances system credibility.
Data Real-Time Performance: Measured by the delay between data acquisition and display; shorter delays enable faster response.
System Stability: Assessed via continuous uptime and failure rate—stable operation minimizes monitoring interruptions and missed warnings.
4.2 Evaluation Results
After optimization, data display latency dropped from ~3 seconds to under 1 second, significantly improving situational awareness. Monthly fault occurrences decreased from ~5 to ~3. Enhanced hardware cooling and optimized software memory management reduced system crashes. For rare fault scenarios, expanding the fault sample database and applying deep learning algorithms improved recognition of complex failure modes, supporting continuous system refinement.
5. Application Expansion and Technical Advancement
5.1 Application Expansion
Within the power sector, the system offers broad integration potential:
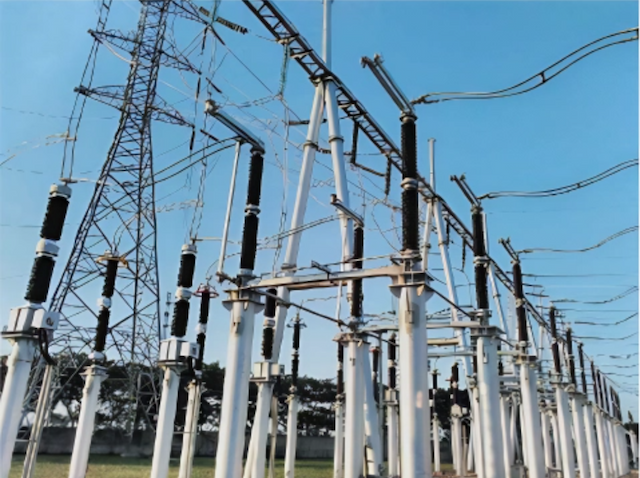
Substation Integration: It can fuse with monitoring systems for transformers, circuit breakers, etc., creating a unified data platform for centralized analysis. For instance, combining disconnector temperature anomalies with transformer load and oil temperature data enables holistic substation health assessment—allowing proactive load redistribution before failures occur.
Smart Grid Operations: Integrated with grid dispatch systems, it provides real-time disconnector status to dispatch centers, enabling dynamic operational adjustments. Successful integration hinges on standardized data formats, universal communication protocols, and advanced analytics software that builds cross-device correlation models for system-wide dynamic monitoring.
5.2 Technical Enhancement Directions
Future upgrades should leverage emerging technologies:
Advanced Sensors: MEMS (Micro-Electro-Mechanical Systems) sensors offer small size, low power, and high precision—e.g., MEMS accelerometers for superior vibration monitoring. Fiber-optic temperature sensors eliminate electromagnetic interference for more reliable readings.
AI Algorithms: Deep learning models like CNNs (Convolutional Neural Networks) can automatically learn complex fault patterns from large datasets, enhancing prediction accuracy.
Cybersecurity: End-to-end encryption secures data in transit and at rest. Strict role-based access control prevents unauthorized data exposure, meeting future demands for data privacy and security in power systems.
6. Conclusion
The remote monitoring and fault early-warning system for high-voltage disconnectors plays a vital role in modern power systems. This paper outlines its design principles, architecture, and synergistic integration of monitoring and data analytics to ensure robust functionality. Through rigorous deployment and testing, system stability and reliability are validated. Performance metrics highlight strengths and guide ongoing optimization. With significant potential for cross-system integration and technological evolution—especially in MEMS sensing, AI-driven analytics, and cybersecurity—the system will be a key enabler of intelligent, resilient, and secure power grid operations.